As we celebrate Labor Day, we can think about the hard work we perform for our communities. We can also consider the work of those before us and how their efforts helped build this great nation we know and love. I hope you have a great Labor Day weekend!
Market Commentary – February 25, 2019
Investors were pleased with the Federal Reserve’s (Fed) new approach to its balance sheet.
The Fed delivered its semi-annual Monetary Policy Report to Congress last week. The report recapped the events of late 2018 and reiterated the Fed’s intention to “…be patient as it determines what future adjustments to the federal funds rate may be appropriate to support the Committee’s congressionally mandated objectives of maximum employment and price stability.”
In other words, rate hikes are on hold for now.
The Fed also addressed issues related to its balance sheet, which grew from $900 billion at the end of 2006 – about 6 percent of the United States’ gross domestic product (GDP) – to almost $4.5 trillion at the end of 2014 – about 25 percent of U.S. GDP. (GDP is the value of all goods and services produced in the United States in a given period.)
The balance sheet more than quadrupled during the past decade because the Fed began buying Treasuries and mortgage-backed securities, a policy called quantitative easing, in an effort to restore the U.S. economy to health, according to The Hutchins Center of the Brookings Institute.
Friday’s report indicated the Fed will not shrink its balance sheet to pre-crisis levels, reported Erwida Maulia for Financial Times. Markets responded positively to the news: “U.S. stocks and Treasuries were comfortably higher at midday on Friday as the Federal Reserve signaled it will hold a much larger balance sheet in the long term than it did before the financial crisis, helping ease investor concerns about tightening financial conditions.”
Investors also remained optimistic about trade talks between the United States and China. Major U.S. stock indices finished the week higher.
As levels continue to rise, people and companies around the world are likely to be affected. Morgan Stanley reported, “Many coastal cities around the world that look attractive to real assets investors – for example, Miami, New York, Boston, Osaka, Guangzhou, and Mumbai – are particularly vulnerable to flooding and other weather-related problems. And, infrastructure assets favored by investors, like airports, cell towers, and oil and natural gas pipelines, are often located in places prone to storms and extreme heat…Insurance will continue to be an important safeguard, but a limited one.”
Protecting property and improving infrastructure is likely to change demand for specific goods and services. Sarah Green Carmichael of Barron’s reported, “As we rush to protect basements and beach houses, companies in the home-improvement retail sector should benefit…So should companies that make products to cope with flooding, such as commercial-grade water pumps…Upgrades to infrastructure also mean good news for the construction sector…”
The textile industry – think fabrics and clothing – may also be affected since major exporters like Bangladesh, Indonesia, and the Philippines, which supply 10 percent of the textiles and clothing imported by the United States, are vulnerable to coastal flooding.
Sea level is a macroeconomic issue. It has the potential to affect output and income across the global economy. Investment managers who take a top-down approach to investing consider the ways in which macroeconomic factors, like changing sea levels, could affect the market as a whole, as well as the share prices of specific companies. Bottom-up investors take a different approach. They consider company fundamentals, such as management team and earnings growth potential, first.
Weekly Focus – Think About It
“They always say time changes things, but you actually have to change them yourself.”
–Andy Warhol, American artist
Best regards,
John F. Reutemann, Jr., CLU, CFP®
P.S. Please feel free to forward this commentary to family, friends, or colleagues. If you would like us to add them to the list, please reply to this email with their email address and we will ask for their permission to be added.
Investment advice offered through Research Financial Strategies, a registered investment advisor.
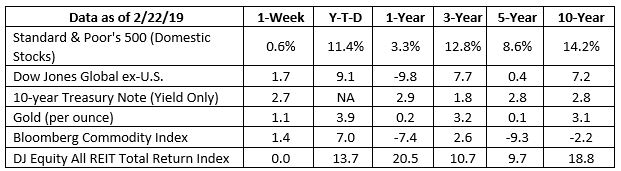
S&P 500, Dow Jones Global ex-US, Gold, Bloomberg Commodity Index returns exclude reinvested dividends (gold does not pay a dividend) and the three-, five-, and 10-year returns are annualized; the DJ Equity All REIT Total Return Index does include reinvested dividends and the three-, five-, and 10-year returns are annualized; and the 10-year Treasury Note is simply the yield at the close of the day on each of the historical time periods.
Sources: Yahoo! Finance, Barron’s, djindexes.com, London Bullion Market Association.
Past performance is no guarantee of future results. Indices are unmanaged and cannot be invested into directly. N/A means not applicable.
Most Popular Financial Stories
Happy Labor Day
read more
Special Edition from Jack Reutemann
Friends, Family, Clients, The market's charts look worse than the actual numbers. The S&P 500 is down 4.62% from its all-time high. While not catastrophic, it's a significant drop. As usual, we've adopted a defensive stance to protect our substantial SPXL gains by...
Happy Independence Day
Happy 4th of July! Whether you’re celebrating with a cookout, a family gathering, or watching the fireworks with friends, Independence Day reminds us how lucky we all are to belong to this great nation. Enjoy the long weekend and join us in giving thanks for the...
Inflation Drops; Fed Changes Outlook
“It ain’t over ‘til it’s over.” Words of wisdom from baseball legend Yogi Berra. And words that Fed Chair Jerome Powell has taken to heart. “Inflation has eased over the past year but remains elevated,” Powell said following the Fed’s June meeting. In other words, “it...
This Memorial Day…
Memorial Day is so much more than a long weekend. It is a chance for us to remember those who gave all for this great nation and the freedoms it offers. This Memorial Day, we pay tribute to the lives and legacies of those who made the ultimate sacrifice in serving our...
Special content from Jack, very short read!
Uh oh! Signs of a potential financial market correction may be on the horizon: The S&P 500 is down 4% from its all-time high. Investors are showing increased interest in gold, silver, copper, and other commodities, which are often seen as safe havens during...
* Government bonds and Treasury Bills are guaranteed by the U.S. government as to the timely payment of principal and interest and, if held to maturity, offer a fixed rate of return and fixed principal value. However, the value of fund shares is not guaranteed and will fluctuate.
* Corporate bonds are considered higher risk than government bonds but normally offer a higher yield and are subject to market, interest rate and credit risk as well as additional risks based on the quality of issuer coupon rate, price, yield, maturity, and redemption features.
* The Standard & Poor’s 500 (S&P 500) is an unmanaged group of securities considered to be representative of the stock market in general. You cannot invest directly in this index.
* All indexes referenced are unmanaged. Unmanaged index returns do not reflect fees, expenses, or sales charges. Index performance is not indicative of the performance of any investment.
* The Dow Jones Global ex-U.S. Index covers approximately 95% of the market capitalization of the 45 developed and emerging countries included in the Index.
* The 10-year Treasury Note represents debt owed by the United States Treasury to the public. Since the U.S. Government is seen as a risk-free borrower, investors use the 10-year Treasury Note as a benchmark for the long-term bond market.
* Gold represents the afternoon gold price as reported by the London Bullion Market Association. The gold price is set twice daily by the London Gold Fixing Company at 10:30 and 15:00 and is expressed in U.S. dollars per fine troy ounce.
* The Bloomberg Commodity Index is designed to be a highly liquid and diversified benchmark for the commodity futures market. The Index is composed of futures contracts on 19 physical commodities and was launched on July 14, 1998.
* The DJ Equity All REIT Total Return Index measures the total return performance of the equity subcategory of the Real Estate Investment Trust (REIT) industry as calculated by Dow Jones.
* The Dow Jones Industrial Average (DJIA), commonly known as “The Dow,” is an index representing 30 stock of companies maintained and reviewed by the editors of The Wall Street Journal.
* The NASDAQ Composite is an unmanaged index of securities traded on the NASDAQ system.
* International investing involves special risks such as currency fluctuation and political instability and may not be suitable for all investors. These risks are often heightened for investments in emerging markets.
* Yahoo! Finance is the source for any reference to the performance of an index between two specific periods.
* Opinions expressed are subject to change without notice and are not intended as investment advice or to predict future performance.
* Economic forecasts set forth may not develop as predicted and there can be no guarantee that strategies promoted will be successful.
* Past performance does not guarantee future results. Investing involves risk, including loss of principal.
* You cannot invest directly in an index.
* Stock investing involves risk including loss of principal.
* The foregoing information has been obtained from sources considered to be reliable, but we do not guarantee it is accurate or complete.
* There is no guarantee a diversified portfolio will enhance overall returns or outperform a non-diversified portfolio. Diversification does not protect against market risk.
* Asset allocation does not ensure a profit or protect against a loss.
* Consult your financial professional before making any investment decision.
* To unsubscribe from the Weekly Market Commentary please reply to this e-mail with “Unsubscribe” in the subject.
Sources:
https://www.federalreserve.gov/monetarypolicy/2019-02-mpr-summary.htm
https://www.federalreserve.gov/monetarypolicy/2019-02-mpr-part2.htm#xsubsection-1553-1b5b0b6b
https://www.investopedia.com/ask/answers/what-is-gdp-why-its-important-to-economists-investors/
https://www.ft.com/content/a80b032e-36c2-11e9-bb0c-42459962a812
https://science2017.globalchange.gov/chapter/12/ (Key Finding 1 and Key Finding 2)
https://tidesandcurrents.noaa.gov/sltrends/sltrends.html
https://www.morganstanley.com/ideas/real-assets-climate-resilience
https://www.merriam-webster.com/dictionary/macroeconomics
https://www.investopedia.com/articles/investing/092215/bottomup-and-topdown-investing-explained.asp
https://www.goodreads.com/quotes/tag/change


