Weekly Market Commentary 7/26/2021

Weekly Market Commentary 7/26/2021

How Are Your Investments Doing Lately?  Receive A Free, No-Obligation 2nd Opinion On Your Investment Portfolio >

Weekly Financial Market Commentary

July 26, 2021

Our Mission Is To Create And Preserve Client Wealth

Shortest ever.

Last week, the National Bureau of Economic Research (NBER) finally announced the official dates for the recession that occurred in 2020. Economic activity peaked in February 2020 and bottomed in April 2020. That makes the pandemic recession the shortest in American history.

According to the NBER, “The recent downturn had different characteristics and dynamics than prior recessions. Nonetheless, the committee concluded that the unprecedented magnitude of the decline in employment and production, and its broad reach across the entire economy, warranted the designation of this episode as a recession, even though the downturn was briefer than earlier contractions.”

Since then, the United States’ economy has accelerated like a sports car on the German Autobahn, leading the developed world in the race toward economic recovery. A gradual slowdown was inevitable. However, three obstacles in the road may result in a sharp deceleration, reported The Economist.

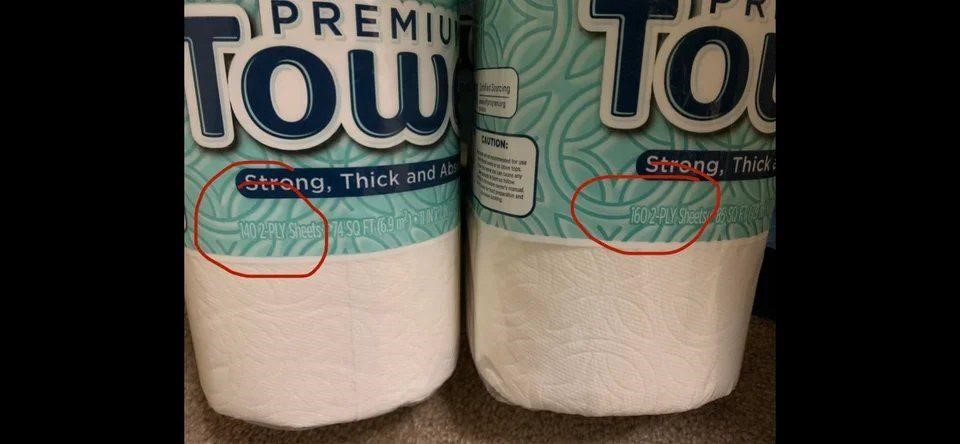
#1. Inflation. A shortage of goods triggered inflation. Consumers have noted some price hikes, although others are less clear obvious. Makers of cereal, snacks, candy, and other products, are offering unchanged packages, priced as usual, that hold smaller quantities of product, reported Axios. The technique is known as shrinkflation.

#2. The end of pandemic policies. Enhanced unemployment benefits end in September, and the national moratorium on evictions ends in late July. The latter was the first of its kind and no one is certain how unwinding it will affect the economy, reported The Economist. Almost 36 percent of adults living in households that are behind on rent or mortgage payments, according to the latest Household Pulse Survey. We could see a housing boom and a housing crisis simultaneously.

#3. Spread of the Delta variant. The average number of coronavirus cases is up more than 180 percent over the last two weeks. “In the near term, the economic impact of the new wave of the pandemic in the U.S. could hinge on whether governments ratchet up restrictions intended to curb the virus’ spread.” reported Josh Nathan-Kazis of Barron’s.

While risks to economic growth persist, the earnings of publicly traded companies are strong. So far, 24 percent of the companies in the Standard & Poor’s (S&P) 500 Index have reported second quarter earnings. Year-to-year blended earnings growth has been stellar, in part, because of how bad things were during the second quarter of last year, reported John Butters of FactSet.

Net profit margins, which could have been trimmed by inflation, are currently 12.4 percent. That’s the second highest level since FactSet began tracking data in 2008. Analysts anticipate profit margins will average 12 percent through the end of 2021.

HOW MUCH ARE OLYMPIC MEDALS WORTH? The Tokyo Organizing Committee of the Olympic and Paralympic Games took a new approach to producing medals. “Approximately 5,000 medals have been produced from small electronic devices that were contributed by people all over Japan…From the procurement of the metals to the development of the medal design, the entire country of Japan was involved in the production of the medals for the Tokyo 2020 Games – a project that was only possible with the participation of people across the nation.”

The current medal format – awarding gold, silver and bronze medals to the top finishers in each event – was introduced during the 1904 Olympics. For a few years, around that time, the medals were made of gold, silver and bronze, but that’s no longer the case. The medals awarded at the Tokyo Games are composed of a variety of metals.

·         Olympic gold. The gold medal contains 550 grams of silver ($490) covered in 6 grams of gold plating ($380). That puts its monetary value at about $870.

·         Olympic silver. The silver medal is made of pure silver. At the 2020 Olympics, the medal weighs in at about 550 grams, and its value is about $490.

·         Olympic bronze. The bronze medal is comprised of 450 grams – almost a pound – of red brass. Red brass is 95 percent copper and 3 percent zinc, and is valued at about $2.40 a pound. The medal’s monetary value is about $2.40.

Of course, the real answer to the question about the value of Olympic medals is that they are priceless. The achievement they represent – becoming one of the world’s best athletes in a sport – has a value that cannot be measured in dollars and cents. 

Weekly Focus – Think About It
“Never underestimate the power of dreams and the influence of the human spirit. We are all the same in this notion: The potential for greatness lives within each of us.”
– Wilma Rudolph, Four-time Olympic medalist

Most Popular Financial Stories

A.I. Is Everywhere

A.I. Is Everywhere

If you've heard CEOs mention "A.I." multiple times during second-quarter conference calls or on the news, you're not imagining it. There have been an astounding 1,072...

read more
Happy Independence Day

Happy Independence Day

The Fourth of July is just ahead – a chance for us all to get together and celebrate what makes America so special. As Americans, we have the liberty to act, speak, think,...

read more


Investment advice offered through Research Financial Strategies, a registered investment advisor.
* This newsletter and commentary expressed should not be construed as investment advice.
* Government bonds and Treasury Bills are guaranteed by the U.S. government as to the timely payment of principal and interest and, if held to maturity, offer a fixed rate of return and fixed principal value.  However, the value of fund shares is not guaranteed and will fluctuate.
* Corporate bonds are considered higher risk than government bonds but normally offer a higher yield and are subject to market, interest rate and credit risk as well as additional risks based on the quality of issuer coupon rate, price, yield, maturity, and redemption features.
* The Standard & Poor’s 500 (S&P 500) is an unmanaged group of securities considered to be representative of the stock market in general. You cannot invest directly in this index.
* All indexes referenced are unmanaged. The volatility of indexes could be materially different from that of a client’s portfolio. Unmanaged index returns do not reflect fees, expenses, or sales charges. Index performance is not indicative of the performance of any investment. You cannot invest directly in an index.
* The Dow Jones Global ex-U.S. Index covers approximately 95% of the market capitalization of the 45 developed and emerging countries included in the Index.
* The 10-year Treasury Note represents debt owed by the United States Treasury to the public. Since the U.S. Government is seen as a risk-free borrower, investors use the 10-year Treasury Note as a benchmark for the long-term bond market.
* Gold represents the afternoon gold price as reported by the London Bullion Market Association. The gold price is set twice daily by the London Gold Fixing Company at 10:30 and 15:00 and is expressed in U.S. dollars per fine troy ounce.
* The Bloomberg Commodity Index is designed to be a highly liquid and diversified benchmark for the commodity futures market. The Index is composed of futures contracts on 19 physical commodities and was launched on July 14, 1998.
* The DJ Equity All REIT Total Return Index measures the total return performance of the equity subcategory of the Real Estate Investment Trust (REIT) industry as calculated by Dow Jones.
* The Dow Jones Industrial Average (DJIA), commonly known as “The Dow,” is an index representing 30 stock of companies maintained and reviewed by the editors of The Wall Street Journal.
* The NASDAQ Composite is an unmanaged index of securities traded on the NASDAQ system.
* International investing involves special risks such as currency fluctuation and political instability and may not be suitable for all investors. These risks are often heightened for investments in emerging markets.
* Yahoo! Finance is the source for any reference to the performance of an index between two specific periods.
* Opinions expressed are subject to change without notice and are not intended as investment advice or to predict future performance.
* Economic forecasts set forth may not develop as predicted and there can be no guarantee that strategies promoted will be successful.
* Past performance does not guarantee future results. Investing involves risk, including loss of principal.
* The foregoing information has been obtained from sources considered to be reliable, but we do not guarantee it is accurate or complete.
* There is no guarantee a diversified portfolio will enhance overall returns or outperform a non-diversified portfolio. Diversification does not protect against market risk.
* Asset allocation does not ensure a profit or protect against a loss.
* Consult your financial professional before making any investment decision.
* To unsubscribe from the Weekly Market Commentary please reply to this e-mail with “Unsubscribe” in the subject.


Investment advice offered through Research Financial Strategies, a registered investment advisor.


Sources:
https://www.nber.org/news/business-cycle-dating-committee-announcement-july-19-2021
https://www.economist.com/leaders/2021/07/24/does-america-face-a-growth-slowdown (or go to https://resources.carsongroup.com/hubfs/WMC-Source/2021/07-26-21_Economist_Does%20America%20Face%20a%20Slowdown%20in%20Economic%20Growth_2.pdf)
https://www.axios.com/shrinkflation-inflation-cheerios-78a856e1-342f-404f-8d09-ad0da57a299e.html
https://www.economist.com/united-states/2021/07/24/as-moratoriums-lift-will-america-face-a-wave-of-foreclosures-and-evictions (or go to https://resources.carsongroup.com/hubfs/WMC-Source/2021/07-26-21_Economist_As%20Moratoriums%20Lift_4.pdf)
https://www.census.gov/data-tools/demo/hhp/#/?measures=EVICTFOR&periodSelector=33
https://www.barrons.com/articles/delta-variant-covid-19-economy-51627066659 (or go to https://www.barrons.com/articles/delta-variant-covid-19-economy-51627066659)
https://www.factset.com/hubfs/Website/Resources%20Section/Research%20Desk/Earnings%20Insight/EarningsInsight_072321.pdf
https://www.barrons.com/articles/dow-jones-industrial-average-record-covid-19-51627088150?refsec=the-trader (or go to https://resources.carsongroup.com/hubfs/WMC-Source/2021/07-26-21_Barrons_The%20Dow%20Just%20Hit%2035000_8.pdf)
https://www.treasury.gov/resource-center/data-chart-center/interest-rates/Pages/TextView.aspx?data=yield
https://olympics.com/tokyo-2020/en/games/olympics-medals/
https://olympics.com/en/olympic-games/olympic-medals
https://olympics.com/tokyo-2020/en/games/olympics-medals-design/
https://www.bloomberg.com/markets/commodities/futures/metals
https://www.fullcirclerecyclingri.com/current-prices
https://olympic-speakers.com/news/10-inspirational-quotes/

Canaries in the coal mine!

Canaries in the coal mine!

Inflation and Other Hot Topics

When Your Dollar Shrinks

The best of financial planners must consider what happens to investors when their dollar begins to shrink. They planned on spending a certain amount per month in  retirement, for example, but … oops … the prices of gasoline and Cheerios went through the roof. If a set amount of dollars buys less, then the only solution is to increase the number of dollars available. Otherwise, the quality of life shrinks along with the U.S. dollar.

How to increase the number of dollars available? How to give yourself a raise?

Well, that’s what we’re here to do for you, our client. And we remain proud of, and steadfast in, that duty, especially these days when inflationary trends are sounding the alarm.

The Federal Reserve Beige Book

According to the Fed’s Beige Book, the recovering U.S. economy is grappling with significant labor shortages and higher prices for consumer goods.

The Outlook

The Federal Reserve’s latest deep dive on the economy confirmed the obvious: U.S. economic growth is picking up steam, but the recovery is being restrained by widespread shortages of labor and supplies.

While the economy has made a lot of progress, Fed Chairman Powell said on Wednesday that it still needs a lot of support from the Fed. He pointed to the millions of people currently out of work.

The Big Picture

The economy has plenty of momentum. Coronavirus cases are low, most government restrictions have been lifted, and Americans are spending plenty of money. Indeed, consumer spending accounts for about 70% of U.S. economic activity.

“The U.S. economy strengthened further from late May to early July, displaying moderate to robust growth,” the Beige Book said.

Cars and Trucks

In 2020, sales of used light vehicles in the United States came to around 39.3 million units. In the same year, approximately 14 million new light trucks and automobiles were sold here.

Currently, about 280 million vehicles operate on the streets of America. an increase of about 1.6 percent over the past year. The rising demand for vehicles means that used vehicle inventories are declining. The impact on prices is not surprising. Just last month, in June alone, the prices of used cars increased 10.5%. In the same month, new car prices rose 2.2%.

Construction

The construction industry in the United States accounts for 3.36% on the country’s GDP.  According to economic forecasts, construction in the United States will grow about 15.6% and amass a value of $1.515 trillion in 2021.

Although the construction and building materials industry in the United States has been facing challenges in the recent past that have slowed down its short-term growth, the medium and long-term growth in the industry is projected to remain relatively constant and positive. The expected compound annual growth rate will be 4.7% from the year 2021 to 2025. Moreover, the construction output for the US construction and building materials industry is projected to be as high as $1.819 trillion until the year 2025.

The Pandemic and the Building Industry

As the COVID pandemic has brought about a huge increase in outdoor renovation and construction projects, the demand for construction materials is also expected to rise. Consequently, the prices of construction and building materials have risen accordingly. The norm of social distancing during the pandemic has shifted people’s behavior from relaxing and entertaining visitors indoors to outdoors in patios, fire pits, and outdoor kitchens. Tents are in, ballrooms are out.

Even though construction activities have gained importance as the quarantine and lockdowns have lifted, the industry suffered significantly during the peak of the pandemic due to the weakened economy, disturbances in the supply chain, and delays in schedules. Contractors and construction workers suffered, too, as the lockdown required that they remain in their houses for months on end. Accordingly, the demand for building materials fell drastically.

Lumber

Lumber prices turned negative for the year as demand cooled after a red-hot rally.[1] Lumber futures fell 5.6% on Monday, taking it 0.6% below where it started the year. Home improvement demand has dropped, while suppliers have raised production.

Lumber prices have dropped into negative territory for the year after two months of dramatic falls, as the home improvement boom cools and producers increase supply to meet demand.

On Monday, lumber futures for September delivery fell 5.6% to $712.90 per thousand board feet, Bloomberg data showed. The fall took prices 0.6% below where they started the year.

Lumber soared in the first few months of 2021 as Americans stuck at home due to the pandemic renovated their houses and a booming property market added to demand. Prices peaked at more than $1,730 per thousand board feet in May as suppliers struggled to keep up.

But since the May peak, prices have plunged almost 60%. Analysts have said that the loosening of coronavirus restrictions has caused consumers to spend less on home improvements such as new yard decking and more on services like dining out, getting haircuts, and even going to the movies.

The Housing Market Inflates

An inflation storm is coming for the U.S. housing market. Fast-rising housing costs have helped cause the largest increase in inflation since 2008. But the way that government statisticians track the price of consumer goods may be missing just how explosive home-price growth really has been in recent months.

The cost of shelter rose by 0.5% between May and June, according to the latest edition of the monthly consumer price index released Tuesday by the Bureau of Labor Statistics. Compared with last year, however, shelter costs were up 2.6%.

Altogether, the rise in housing prices accounted for roughly a fifth of the overall increase in inflation in June, a reflection of how heavily government economists weight this spending category.

But much of that increase was actually driven by the rising cost of hotels and motel stays, which are factored into the overall shelter figure. Between May and June, the cost of a hotel room increased nearly 8%. Comparatively, housing costs for renters and homeowners rose 0.2% and 0.3% respectively, per the government’s inflation measure.

The latest edition of the consumer price index indicated housing prices have risen 2.6% over the past year, while other reports suggest home prices are up more than 13%.

In 2021, buyers are driving up home prices and homes sell quickly. Some hyperactive buyers make offers without seeing the property and forego contingencies to win bidding wars in the highly competitive housing market. The record-low mortgage rates have really sparked the increase in demand, especially among millennials. And they are encountering a shrinking supply of available homes.

The housing market is still far from normal, with inventories down over 38% year over year and at historic lows. The current supply of homes on the market registers an all-time low, dating back to the turn of the century. Due to a lack of supply and decreasing interest rates or borrowing costs, home prices have continued to rise in double digits. With the recovering economy, more buyers are entering the market. And because of the still-limited supply of housing inventory, home prices continue to rise.

With increased supply, home price growth will gradually moderate, but a broad price decline appears unlikely. The housing market will continue to attract buyers as a result of the drop in mortgage rates, which have fallen below 3%, as well as an increase in new listings. According to Realtor.com’s Hottest Housing Markets data, as of June 29, the most improved metros over the previous year were Tampa-St. Petersburg-Clearwater, Fla.; Detroit-Warren-Dearborn, Mich.; Nashville-Davidson-Murfreesboro-Franklin, Tenn.; Riverside-San Bernardino-Ontario, Calif.; and Jacksonville, Fla.

·         The median existing-home price in May was $350,300, up a record 23.6% from May 2020.

·         Supply shortages are holding new home sales back.

·         New home sales fell 5.9% in May from April, to 769,000.

·         The median sales price of new houses sold in May 2021 was $374,400, up 2.5% from April and 18.1% year-over-year.

According to the latest data from the National Association of Realtors, existing-home sales in May declined 0.9% from a month before a seasonally-adjusted annual rate of 5.80 million from April’s rate of 5.85 million. The 0.9% setback in existing home sales in May was the fourth straight monthly decline. Only one major U.S. region experienced a gain in sales month-over-month, while the other three saw sales fall. Each of the four regions, however, saw double-digit year-over-year growth.

Although housing sales were up 44.6 percent year on year (4.01 million in May 2020), the comparison is heavily skewed because the housing market was effectively shut down for two months at the start of the pandemic. Last summer, the market recovered and remained strong for the rest of the year. In May 2021, the median existing-home price for all housing types was $350,300, up 23.6 percent from last May ($283,500), with price increases in every region.

This is a record high and marks 111 straight months of year-over-year gains since March 2012. The inventory of homes for sale remained relatively low. At the current sales pace, it would take 2.5 months to sell through available inventory—a slight increase from 2.4 months in April, but significantly lower than the 4.6 months of supply at this time last year.

The National Association of Realtors released research earlier this month from the Rosen Consulting Group, estimating that between 5.5 million and 6.8 million new houses are needed to meet the demand. “Home sales fell moderately in May and are now approaching pre-pandemic activity,” said Lawrence Yun, NAR’s chief economist.

Pending Home Sales Rebounded Strongly in May

According to the National Association of Realtors, pending home sales reached their highest level in May since 2005, with gains recorded in all four U.S. regions both month-over-month and year-over-year. Pending home sales increased by 8% in May compared to April and were up 13.1% year on year. Home sales activity had dropped at the same time last year due to the onset of the COVID-19 pandemic.

A pending sale status indicates that the seller accepted an offer from a prospective buyer but that the transaction has not yet closed. Many sellers will prefer to wait for the best and highest offer. Pending home contracts are viewed as a forward-looking indicator of the housing market’s health because they become sales one to two months later.

Existing Housing Sales in May

According to data from the National Association of Realtors:

·         In the Northeast, existing home sales decreased 1.4% in May, but the annual rate of 720,000 represents a 46.9% jump from a year ago.

·         The median price in the Northeast was $384,300, up 17.1% from May 2020.

·         Midwest existing home sales rose 1.6% to an annual rate of 1,310,000 in May, a 27.2% increase from a year ago.

·         The median price in the Midwest was $268,500, an 18.1% increase from May 2020.

·         In the South, existing-home sales declined 0.4%, posting an annual rate of 2,590,000 in May, up 47.2% from the same time one year ago.

·         The median price in the South was $299,400, a 22.6% jump from one year ago.

·         In the West, existing home sales fell 4.1%, recording an annual rate of 1,180,000 in May, a 61.6% climb from a year ago.

·         The median price in the West was $505,600, up 24.3% from May 2020.

New Residential Home Sales

Buyer demand for new homes remains strong, and builders in most markets have little trouble selling the homes they have built. However, supply constraints limit the number of homes they can build and eventually sell, and the sales volume they can comfortably take on without exposing themselves to additional price risks is somewhat limited. Still, new home sales have risen during the pandemic. Those sales allow builders to raise prices.

Buyer traffic is converting into sales at a record rate. Residential construction ended in 2020 on a strong note. Housing starts rose 5.8% to 1.67 million annualized units in December. Total starts were 2.8% higher than a year ago. The demand remains strong as the prime buying season begins to heat up. Sales of new single-family homes in the United States fell to a one-year low in May 2021, as the median price of newly built houses rose due to high raw material costs, including framing lumber.

New home sales decreased 5.9% in May to a seasonally adjusted annual pace of 769,000, down from an upwardly revised April rate of 817,000, according to estimates released jointly by the U.S. Census Bureau and the Department of Housing and Urban Development. Higher building costs, longer delivery times, and general unpredictability in the construction supply chain are now having measurable impacts on new home prices. The median sales price of new houses sold in May 2021 was $374,400.

The average sales price was $430,600. The seasonally‐adjusted estimate of new houses for sale at the end of May was 330,000. This represents a supply of 5.1 months at the current sales rate. The median sales price of new houses jumped 18.1% from a year earlier to $374,400 in May. The average sales price was $435,400. The seasonally adjusted estimate of new houses for sale at the end of April was 316,000. This represents a supply of 4.4 months at the current sales rate.

Because new house sales are recorded when contracts are signed, they are considered a leading housing market indicator. The decrease in new housing sales suggests that demand is diminishing. Applications for house loans have declined this year, as have housing market surveys of potential purchasers.

Shoes? Yes, Shoes

The global footwear market is a multi-billion U.S. dollar industry. The United States has the largest footwear market in the world, amounting to over 91 billion U.S. dollars in revenue in 2019. A part of the clothing and apparel industry, the footwear market is comprised of shoes, sneakers, luxury footwear, athletic footwear, and sporting shoes, as well as other related goods. Footwear products are commonly made of leather, textiles, and a range of synthetic materials.

Nike’s share of US footwear market is 17.9%. Pairs of shoes imported into the USA total 2.47 billion. Advertising spent in the US footwear industry totals $12.6 billion.

Brace Yourself

We don’t have to look far to see evidence of inflation. And we don’t have to wonder why prices are rising. When the Federal Reserve increases the U.S. money supply at an annual rate of 37%,[2] those dollars have to go somewhere. They go into the stock market, into real estate, into art works, and … into the gasoline for your car and the Cheerios for your breakfast.

When those prices rise, so too must your income.

We keep a constant eye on these developments and recognize our duty of making sure your wealth grows at a rate that will protect your standard of living.

If you’d like to review your assets, please call us at 301-294-7500. We are always happy to answer any questions you have.


[1] https://www.nasdaq.com/market-activity/commodities/lbs   

[2] https://mises.org/wire/us-money-supply-was-37-percent-november

Weekly Market Commentary 7/26/2021

Weekly Market Commentary 7/19/2021

How Are Your Investments Doing Lately?  Receive A Free, No-Obligation 2nd Opinion On Your Investment Portfolio >

Weekly Financial Market Commentary

July 19, 2021

Our Mission Is To Create And Preserve Client Wealth

The term “peak growth” has become almost as popular as the comedy show Ted Lasso.

Peak growth is a catchphrase with the potential to mislead. When the term is applied to the U.S. economy, it does not mean the United States economy has reached the pinnacle of growth and it’s all downhill from here. It simply means economic growth is likely to climb at a slower pace than it had previously.

Nicholas Jasinski of Barron’s reported the term is, “…a buzzy phrase used nowadays in discussing the rate of change in corporate earnings, U.S. gross domestic product, stock prices, government and central-bank stimulus and inflation. It’s the trend that matters for investors, and the outlook is moving toward a deceleration on several of those fronts.”

Last week, the bond market appeared to signal slower economic growth ahead, reported Mark DeCambre and Vivien Lou Chen of MarketWatch. Yields on 10-year Treasuries finished the week at 1.3 percent, which was lower than the previous week and well below March highs.

The change in Treasury yields was surprising because of last week’s inflation report from the Bureau of Labor Statistics (BLS), which showed inflation well above the Federal Reserve’s target of 2 percent. The BLS reported inflation was 4.5 percent over the past 12 months when measured using the core Consumer Price Index (CPI), which excludes food and energy prices. With food and energy included, prices were up 5.4 percent.

When inflation rises above the Fed target, it suggests the economy is running too hot and the Federal Reserve, typically, raises the fed funds rate to cool things off. In this case, however, the Fed maintains that higher-than-desirable inflation will prove to be temporary.

The Fed’s expectation is due, in part, to supply chain shortages. The BLS report indicated inflation was up 0.9 percent in the month of June. Used car and truck prices rose 10.5 percent during the month, which accounted for more than one-third of the increase. A significant issue underlying the scarcity of vehicles is a microchip shortage.

“The origin of the shortage dates to early last year when [COVID-19] caused rolling shutdowns of vehicle assembly plants. As the facilities closed, the wafer and chip suppliers diverted the parts to other sectors such as consumer electronics, which weren’t expected to be as hurt by stay-at-home orders,” reported Michael Wayland of CNBC. There are about 1,400 microchips in a new car or truck, according to CNBC, and it can take up to 26 weeks from order to delivery, according to Max Cherney of Barron’s.

While supply chain issues may be resolved with time, another aspect of inflation is wages. Over the last 12 months, wages have increased 6.1 percent, and in June, they were up 1.1 percent. That’s good news for workers, but it’s an aspect of inflation that’s unlikely to be temporary.

A wildcard for global recovery remains COVID-19. Last week, the Centers for Disease Control reported the seven-day moving average for the number of cases was up 69 percent, hospitalizations were up 36 percent and deaths were up 26 percent.

Major U.S. stock indices moved lower last week.

WHAT WILL YOU DO WITH YOUR CHILD TAX CREDIT? Last week, 39 million American households that have children age 18 or younger received their first Advance Child Tax Credit payment.

The Internal Revenue Service (IRS) explained, “Advance Child Tax Credit payments are early payments from the IRS of 50 percent of the estimated amount of the Child Tax Credit that you may properly claim on your 2021 tax return during the 2022 tax filing season. If the IRS has processed your 2020 tax return or 2019 tax return, these monthly payments will be made starting in July and through December 2021, based on the information contained in them.”

The amount Uncle Sam sends depends on the age of the children and the income of the family. Eligible households should receive $300 per month for every child age 6 or younger and $250 per month for every child between the ages of 6 and 17, reported Andrew Keshner of MarketWatch.

For some families, the money will help cover the cost of basic expenses. For others, the cash is a welcome windfall that could be used to:

·         Fund a 529 education savings plan. These plans provide a tax-advantaged way to save and invest for a child or grandchild’s education. Typically, after-tax contributions are invested and any earnings grow tax deferred. If distributions are used to pay qualified education expenses, they are tax free, reported savingforcollege.com.

·         Fund an ABLE account. The Achieving a Better Life Experience (ABLE) Act of 2014 allows Americans with disabilities and their families to save up to $15,000 a year in a tax-deferred account similar to a 529 college savings plan, explained FINRA.

·         Fund a Roth IRA. It may seem counterintuitive to open a retirement account for a 6-year-old, but Bankrate’s Roth IRA Calculator shows that a $3,600 investment, earning 6 percent annually, has the potential to grow to almost $150,000 at retirement by the time a 6-year-old is ready to retire at age 70.

For those who qualify and prefer not to receive payments, the IRS has a website that can be used to manage these payments.

Weekly Focus – Think About It
“There’s nothing that can help you understand your beliefs more than trying to explain them to an inquisitive child.”
― Frank A. Clark, Former U.S. Congressman

Most Popular Financial Stories

A.I. Is Everywhere

A.I. Is Everywhere

If you've heard CEOs mention "A.I." multiple times during second-quarter conference calls or on the news, you're not imagining it. There have been an astounding 1,072...

read more
Happy Independence Day

Happy Independence Day

The Fourth of July is just ahead – a chance for us all to get together and celebrate what makes America so special. As Americans, we have the liberty to act, speak, think,...

read more


Investment advice offered through Research Financial Strategies, a registered investment advisor.
* This newsletter and commentary expressed should not be construed as investment advice.
* Government bonds and Treasury Bills are guaranteed by the U.S. government as to the timely payment of principal and interest and, if held to maturity, offer a fixed rate of return and fixed principal value.  However, the value of fund shares is not guaranteed and will fluctuate.
* Corporate bonds are considered higher risk than government bonds but normally offer a higher yield and are subject to market, interest rate and credit risk as well as additional risks based on the quality of issuer coupon rate, price, yield, maturity, and redemption features.
* The Standard & Poor’s 500 (S&P 500) is an unmanaged group of securities considered to be representative of the stock market in general. You cannot invest directly in this index.
* All indexes referenced are unmanaged. The volatility of indexes could be materially different from that of a client’s portfolio. Unmanaged index returns do not reflect fees, expenses, or sales charges. Index performance is not indicative of the performance of any investment. You cannot invest directly in an index.
* The Dow Jones Global ex-U.S. Index covers approximately 95% of the market capitalization of the 45 developed and emerging countries included in the Index.
* The 10-year Treasury Note represents debt owed by the United States Treasury to the public. Since the U.S. Government is seen as a risk-free borrower, investors use the 10-year Treasury Note as a benchmark for the long-term bond market.
* Gold represents the afternoon gold price as reported by the London Bullion Market Association. The gold price is set twice daily by the London Gold Fixing Company at 10:30 and 15:00 and is expressed in U.S. dollars per fine troy ounce.
* The Bloomberg Commodity Index is designed to be a highly liquid and diversified benchmark for the commodity futures market. The Index is composed of futures contracts on 19 physical commodities and was launched on July 14, 1998.
* The DJ Equity All REIT Total Return Index measures the total return performance of the equity subcategory of the Real Estate Investment Trust (REIT) industry as calculated by Dow Jones.
* The Dow Jones Industrial Average (DJIA), commonly known as “The Dow,” is an index representing 30 stock of companies maintained and reviewed by the editors of The Wall Street Journal.
* The NASDAQ Composite is an unmanaged index of securities traded on the NASDAQ system.
* International investing involves special risks such as currency fluctuation and political instability and may not be suitable for all investors. These risks are often heightened for investments in emerging markets.
* Yahoo! Finance is the source for any reference to the performance of an index between two specific periods.
* Opinions expressed are subject to change without notice and are not intended as investment advice or to predict future performance.
* Economic forecasts set forth may not develop as predicted and there can be no guarantee that strategies promoted will be successful.
* Past performance does not guarantee future results. Investing involves risk, including loss of principal.
* The foregoing information has been obtained from sources considered to be reliable, but we do not guarantee it is accurate or complete.
* There is no guarantee a diversified portfolio will enhance overall returns or outperform a non-diversified portfolio. Diversification does not protect against market risk.
* Asset allocation does not ensure a profit or protect against a loss.
* Consult your financial professional before making any investment decision.
* To unsubscribe from the Weekly Market Commentary please reply to this e-mail with “Unsubscribe” in the subject.


Investment advice offered through Research Financial Strategies, a registered investment advisor.


Sources:
https://www.barrons.com/articles/stock-market-what-to-buy-51626478092?refsec=the-trader (or go to https://resources.carsongroup.com/hubfs/WMC-Source/2021/07-19-21_Barrons_The%20Easy%20Money%20Has%20Been%20Made_1.pdf)
https://www.treasury.gov/resource-center/data-chart-center/interest-rates/Pages/TextView.aspx?data=yieldYear&year=2021
https://www.marketwatch.com/story/10-year-treasury-yield-drifts-down-to-1-30-as-investors-watch-for-second-day-of-powell-testimony-11626349939
https://research.stlouisfed.org/publications/economic-synopses/2021/05/19/two-percent-inflation-over-the-next-year-should-you-take-the-over-or-the-under
https://www.bls.gov/news.release/cpi.nr0.htm
https://www.investopedia.com/articles/03/122203.asp
https://www.cnbc.com/2021/05/14/chip-shortage-expected-to-cost-auto-industry-110-billion-in-2021.html
https://www.barrons.com/articles/chip-shortage-spells-trouble-from-cars-to-game-consoles-51612996675 (or go to https://resources.carsongroup.com/hubfs/WMC-Source/2021/07-19-21_Barrons_Chip%20Shortage%20Spells%20Trouble_8.pdf)
https://www.cdc.gov/coronavirus/2019-ncov/covid-data/covidview/index.html
https://www.marketwatch.com/story/what-will-you-do-with-your-enhanced-child-tax-credit-here-are-3-smart-options-11625779235
https://www.irs.gov/credits-deductions/2021-child-tax-credit-and-advance-child-tax-credit-payments-topic-a-general-information
https://www.savingforcollege.com/intro-to-529s/what-is-a-529-plan
https://www.finra.org/investors/learn-to-invest/types-investments/saving-for-education/able-accounts-529-savings-plans
https://www.bankrate.com/retirement/calculators/roth-ira-plan-calculator/
https://www.brainyquote.com/quotes/frank_a_clark_104546

Significant Shrinkage

Significant Shrinkage

Significant Shrinkage

Buffeted by Inflation

Is it time to double check your household budget?

Chances are the budgeted expenditures of the vast majority of Americans are about to get buffeted. Or so says the Oracle of Omaha.

In the latest shareholder meeting of Berkshire Hathaway, Mr. Buffet sounded an alarm:

We are seeing substantial inflation. We are raising prices. People are raising prices to us, and it’s being accepted.[1]

​Specifically, Mr. Buffett pointed to the rising cost of steel affecting Berkshire’s businesses in housing and furniture.

People have money in their pocket, and they pay higher prices.  It’s almost a buying frenzy. [The economy is] red hot.[2]

​Mr. Buffett isn’t the only town crier sounding the alarm. Consider what happened at Bank of America. BofA has been tracking the “mentions” of the word “inflation” in corporate earnings calls since 2004. In late April, their analysts said, “Buckle up! Inflation in here.”[3] The analysts showed a chart depicting a tripling of inflation “mentions.”

But after another week of earnings calls, the BofA analysts had to revise their findings. They then found that “mentions” of “inflation” had quadrupled.

When Money Chases Assets

We don’t have to look far to see evidence of inflation. And we don’t have to wonder why prices are rising. When the Federal Reserve increases the U.S. money supply at an annual rate of 37%,[4] those dollars have to go somewhere. They go into the stock market, into real estate, into art works, and … into the groceries you buy every week.

Stock Market Is Up

So far this year, the S&P 500 Index is in positive territory.

Housing Prices Are Up

In northern Virginia, the median price of a house rose by 9% in 2020. According to WTOP News:

​The median price of a home that sold in Northern Virginia last year was $590,000, up 9%, and $90,000 more than the median price throughout the D.C. metro.[5]

“Art” Prices Are Way Up

Surely you’ve heard by now that a piece of crypto art sold at Christie’s for $69 million. An artist known as Beeple (a young man in Charleston, South Carolina) had created a piece of digital art for 5,000 consecutive days. He then cleverly combined all 5,000 pieces into a single piece of digital art and made it an NFT (a nonfungible crypto token). Strangely enough, a buyer then plopped down a whopping $69 million for the ownership of this single NFT, which resides somewhere on a blockchain. But we don’t have to pay to see it. It’s all over the Internet. It appears in a CNN article.[6] Take a look:

Shrinkage – Your Grocery Bill

The prices of many grocery items are not going up. But inflation is rampant. How is that possible? One word: shrinkflation.

Instead of raising prices, producers of consumer goods are shrinking the amount in a package. Seemingly, the package size remains the same. But in fact, a smaller quantity is offered at the same price.

Consider this picture of paper towels offered at Costco.[7] The roll on the right has 160 sheets; the one on the left, just 140.

Or check out these pictures of Nathan’s Pretzel Dogs, which appear in an article on Mouseprint.org.[8] The first box contains five; the second, just four.

Shrinkflation Is Everywhere

Scads of manufacturers are now playing the shrinkflation game. Len Penzo, in his blog, reports more than two dozen items where product size has shrunk.[9] Here’s his list of changes in product size since 2020:

Powerade (Was: 32 oz.; Now: 28 oz.)
Lay’s Potato Chips, party bag (Was: 15.25 oz.; Now: 13 oz.)
Nutella (Was: 14.1 oz.; Now: 12.3 oz.)
Puffs tissue (Was: 56 count; Now: 48 count)
Dawn dish soap, small (Was: 8 oz.; Now: 7 oz.)
Hillshire Farms Polska Kielbasa (Was: 16 oz.; Now: 14 oz.)
Nathan’s Hot Dogs, skinless: (Was: 16 count; Now: 14 count)
Keebler Club Crackers (Was: 13.7 oz.; Now: 12.5 oz.)
Charmin Ultra Strong toilet paper (Was 286 sheets; Now: 264 sheets)
Hershey’s kisses, family size (Was: 18 oz.; Now: 16 oz.)

Inflation Primarily Hurts Those on Fixed Incomes

If a family’s income stays the same and prices go up (or shrinked products reduce the amounts purchased), then slowly, over time, that family become poorer.

The solution? Buy assets that are also inflating. If a portion of a family’s savings can be allocated to assets that also inflate, then they have a chance to see their lives remain pretty much the same, or, if they pick the right assets, improve over time.

Which assets?

That’s Our Job at Research Financial Advisors

We have a long track record of protecting a family’s assets and making sure they battle the ravages of inflation. If you’d like us to review the current account we manage for you … or if you have accounts that either you manage or others manage for you … we’re happy to provide a review of your holdings.

Weekly Market Commentary 7/26/2021

Weekly Market Commentary 7/12/2021

How Are Your Investments Doing Lately?  Receive A Free, No-Obligation 2nd Opinion On Your Investment Portfolio >

Weekly Financial Market Commentary

July 12, 2021

Our Mission Is To Create And Preserve Client Wealth

There was a gappers’ block in financial markets last week as equity investors slowed to see what the United States Treasury bond market was up to. 

U.S. Treasury bonds rallied last week. Yields on 10-year Treasuries dropped from 1.43 percent at the start of the week to 1.27 percent on Thursday. The rally was quite a surprise, reported Randall W. Forsyth of Barron’s. “After all, the economy has been booming, accompanied by rising inflation – exactly the opposite of what would be conducive to lower [bond] yields and higher [bond] prices.”

As 10-year Treasury yields reached the lowest level since February, stock investors took time to consider what might have caused yields to retreat. Lower yields often suggest slower growth ahead. There may be potential for global growth to slow if:

A new wave of COVID-19 swamps the global recovery. Twenty-four U.S. states saw the number of COVID-19 cases move higher by 10 percent or more last week, reported Aya Elamroussi of CNN. The Delta variant of the virus accounts for more than one-half of all new cases. Last week, the global death toll reached 4 million and Japan, host of the 2020 Olympic games, declared a state of emergency.

China’s banking system is in trouble. There was another surprise last week. “…China’s central bank announced a half a percentage point cut to banks’ reserve ratio requirements, potentially increasing the profitability of their loans but also stirring concerns about the health of their balance sheets following a debt-fueled property boom,” reported Naomi Rovnick, Thomas Hale, and Francesca Friday of Financial Times.

U.S. economic growth falters as monetary and fiscal stimulus recede. “…the bond market is now adjusting to the prospect of more moderate growth in the second half, with reduced fiscal largess and no $1,400 or $600 stimulus checks. And it’s looking ahead to the eventual prospect of the Federal Reserve throttling back its securities purchases, which currently pump $120 billion a month into the financial system,” reported Barron’s.

When was the Euro 2020 tournament played? If you’re a soccer fan, you know the answer is last month. The tournament took place in 2021, although the name was not changed because the tournament was intended to celebrate the 60th anniversary of the European Football Championship, which occurred in 2020, reported Joe Sommerlad of The Independent. Also, the merchandise had already been produced with a 2020 logo.

The tournament final (England vs. Italy) had yet to be played when this was written, but it’s never too early for tournament trivia. See what you know about Euro 2020 by taking this brief quiz.

1.    There were more ‘own goals’ in Euro 2020 than in all other European championships combined. How many were there before the final match?

a.    5
b.    6
c.     9
d.    11

2.    What is the nickname of the Italian national team?

a.    Il Nerazzurri (The Black and Blues)
b.    Gli Azzurri (The Blues)
c.     Le Rondinelle (The Little Swallows)
d.    Il Toro (The Bull)

3.    How many major tournaments had the English national team, nicknamed The Three Lions, won before the Euro 2020 final?

a.    1
b.    2
c.     3
d.    4

4.    Euro 2020 prize money was about 10 percent higher than Euro 2016 prize money. Every team that participated in the tournament earned about £8 million (about $11 million). How much did the team that lifted the winning trophy earn?

a.    About £12 million (about $17 million)
b.    About £17 million (about $24 million)
c.     About £24 million (about $33 million)
d.    About £33 million (about $46 million)

The Economist explained the importance of European football like this, “On a continent where the facets of nationhood are disappearing, be they banal (customs arrangements), the everyday (currency) or the emotive (borders), football is a way of clinging on.”

Answers: (1) d; (2) b; (3) a; (4) c

Weekly Focus – Think About It
“A champion is someone who does not settle for that day’s practice, that day’s competition, that day’s performance. They are always striving to be better. They don’t live in the past.”
– Briana Scurry, Former goalkeeper, U.S. Women’s National Soccer Team

Most Popular Financial Stories

A.I. Is Everywhere

A.I. Is Everywhere

If you've heard CEOs mention "A.I." multiple times during second-quarter conference calls or on the news, you're not imagining it. There have been an astounding 1,072...

read more
Happy Independence Day

Happy Independence Day

The Fourth of July is just ahead – a chance for us all to get together and celebrate what makes America so special. As Americans, we have the liberty to act, speak, think,...

read more


Investment advice offered through Research Financial Strategies, a registered investment advisor.
* This newsletter and commentary expressed should not be construed as investment advice.
* Government bonds and Treasury Bills are guaranteed by the U.S. government as to the timely payment of principal and interest and, if held to maturity, offer a fixed rate of return and fixed principal value.  However, the value of fund shares is not guaranteed and will fluctuate.
* Corporate bonds are considered higher risk than government bonds but normally offer a higher yield and are subject to market, interest rate and credit risk as well as additional risks based on the quality of issuer coupon rate, price, yield, maturity, and redemption features.
* The Standard & Poor’s 500 (S&P 500) is an unmanaged group of securities considered to be representative of the stock market in general. You cannot invest directly in this index.
* All indexes referenced are unmanaged. The volatility of indexes could be materially different from that of a client’s portfolio. Unmanaged index returns do not reflect fees, expenses, or sales charges. Index performance is not indicative of the performance of any investment. You cannot invest directly in an index.
* The Dow Jones Global ex-U.S. Index covers approximately 95% of the market capitalization of the 45 developed and emerging countries included in the Index.
* The 10-year Treasury Note represents debt owed by the United States Treasury to the public. Since the U.S. Government is seen as a risk-free borrower, investors use the 10-year Treasury Note as a benchmark for the long-term bond market.
* Gold represents the afternoon gold price as reported by the London Bullion Market Association. The gold price is set twice daily by the London Gold Fixing Company at 10:30 and 15:00 and is expressed in U.S. dollars per fine troy ounce.
* The Bloomberg Commodity Index is designed to be a highly liquid and diversified benchmark for the commodity futures market. The Index is composed of futures contracts on 19 physical commodities and was launched on July 14, 1998.
* The DJ Equity All REIT Total Return Index measures the total return performance of the equity subcategory of the Real Estate Investment Trust (REIT) industry as calculated by Dow Jones.
* The Dow Jones Industrial Average (DJIA), commonly known as “The Dow,” is an index representing 30 stock of companies maintained and reviewed by the editors of The Wall Street Journal.
* The NASDAQ Composite is an unmanaged index of securities traded on the NASDAQ system.
* International investing involves special risks such as currency fluctuation and political instability and may not be suitable for all investors. These risks are often heightened for investments in emerging markets.
* Yahoo! Finance is the source for any reference to the performance of an index between two specific periods.
* Opinions expressed are subject to change without notice and are not intended as investment advice or to predict future performance.
* Economic forecasts set forth may not develop as predicted and there can be no guarantee that strategies promoted will be successful.
* Past performance does not guarantee future results. Investing involves risk, including loss of principal.
* The foregoing information has been obtained from sources considered to be reliable, but we do not guarantee it is accurate or complete.
* There is no guarantee a diversified portfolio will enhance overall returns or outperform a non-diversified portfolio. Diversification does not protect against market risk.
* Asset allocation does not ensure a profit or protect against a loss.
* Consult your financial professional before making any investment decision.
* To unsubscribe from the Weekly Market Commentary please reply to this e-mail with “Unsubscribe” in the subject.


Investment advice offered through Research Financial Strategies, a registered investment advisor.

Sources:

https://finance.yahoo.com/quote/%5ETNX/history?p=%5ETNX (or go to https://resources.carsongroup.com/hubfs/WMC-Source/2021/07-12-21_Yahoo%20Finance_Treasury%20Yield%2010%20Years_1.pdf
https://www.barrons.com/articles/bonds-odd-behavior-may-presage-weaker-second-half-economy-51625879881 (or go to https://resources.carsongroup.com/hubfs/WMC-Source/2021/07-12-21_Barrons_Bonds%20Odd%20Behavior_2.pdf)
https://www.cnn.com/2021/07/08/health/us-coronavirus-thursday/index.html
https://apnews.com/article/japan-coronavirus-pandemic-olympic-games-2020-tokyo-olympics-sports-f757eef4c7b7a606232145444a52e57f
https://www.ft.com/content/596c6ab3-e1c7-4c33-b2e0-c11077ce89a8 (or go to https://resources.carsongroup.com/hubfs/WMC-Source/2021/07-12-21_Financial%20Times_US%20and%20European%20Sotcks%20Rebound_5.pdf)
https://www.barrons.com/articles/stock-market-news-covid-19-51625874629?refsec=the-trader (or go to https://resources.carsongroup.com/hubfs/WMC-Source/2021/07-12-21_Barrons_Stock%20Market%20Can%20Continue%20to%20Grow_6.pdf)
https://www.independent.co.uk/sport/football/why-is-euro-2020-not-2021-b1865025.html
https://www.france24.com/en/live-news/20210709-make-no-mistake-euro-2020-littered-with-own-goals
https://www.uefa.com/uefaeuro-2020/news/0268-12219cce4a75-00dfa3b36740-1000–euro-2020-team-nicknames/
https://en.wikipedia.org/wiki/History_of_the_England_national_football_team
https://theathletic.com/news/euro-2020-prize-money-england-italy/fo7GmuCaBKmD
https://www.economist.com/europe/2021/07/01/euro-2020-politics-by-other-means (or go to https://resources.carsongroup.com/hubfs/WMC-Source/2021/07-12-21_Economist_Euro%202020_Politics%20By%20Other%20Means_12.pdf)
https://vocal.media/cleats/the-most-famous-soccer-quotes-of-all-time

6Lc_psgUAAAAAA9c7MediJBuq3wAxIyxDSt73c9j