Market Commentary

Market Commentary

How Are Your Investments Doing Lately?  Receive A Free, No-Obligation 2nd Opinion On Your Investment Portfolio >

Weekly Financial Market Commentary

September 28, 2020

Our Mission Is To Create And Preserve Client Wealth

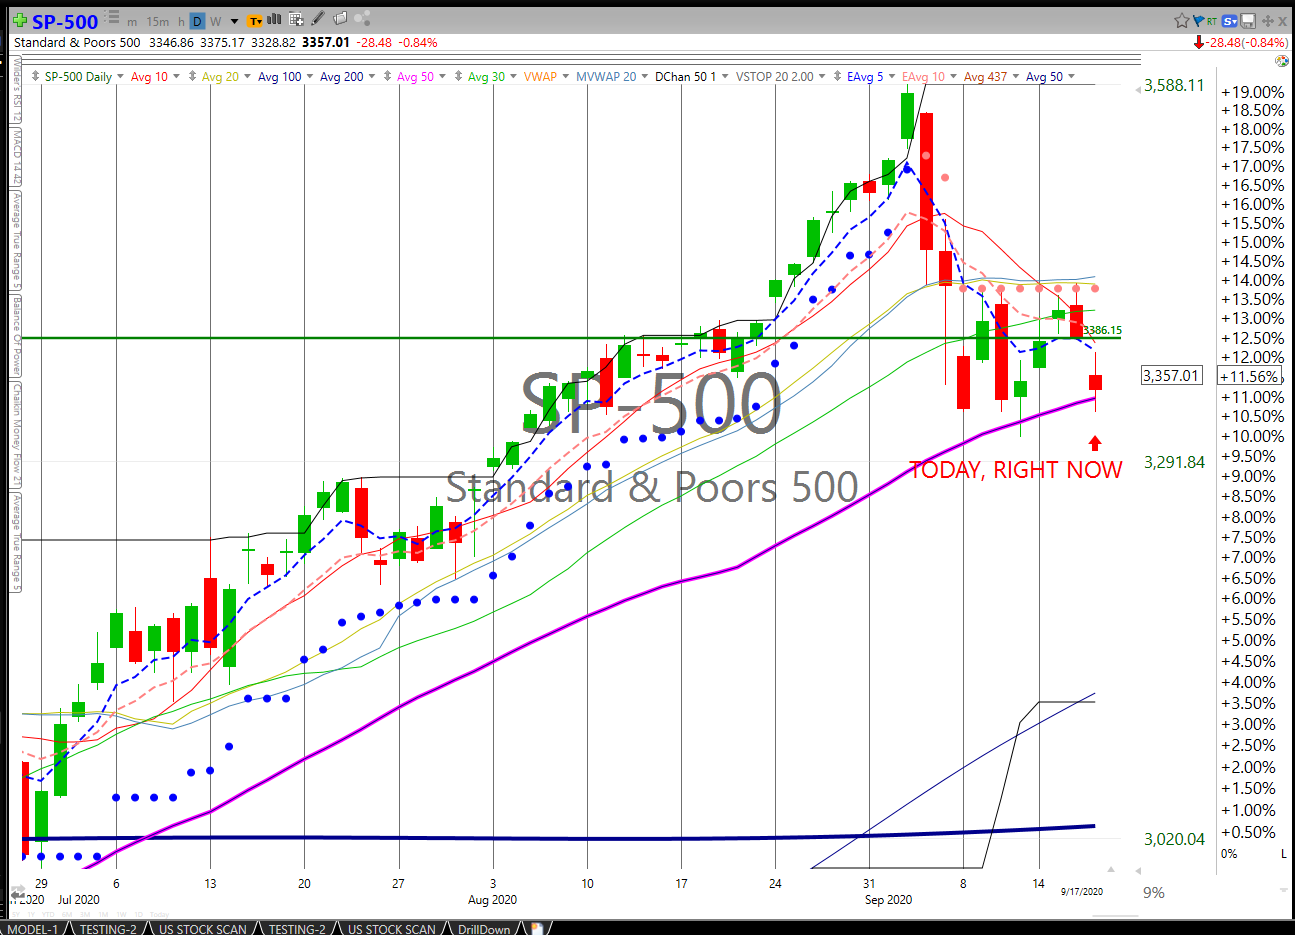
For four weeks, the U.S. stock market has sparked and sputtered like a campfire in light rain.

Today, pandemic-driven demand is providing fuel for the investors. The need for certain types of products and services has accelerated and innovation is creating new opportunities. Consider:

  • Technology. Today, digital technologies support nearly all group interactions, which has accelerated innovation. Traditional video communications platforms are in high demand, and multi-person virtual platforms are emerging. Robotics innovations are racing ahead, too. Robotic dogs enforce social distancing in Singaporean parks, reported Other types of robots sanitize streets and facilitate contactless delivery around the globe.
  • Consumer products and services. COVID-19 increased demand for staples, cleaning, and personal hygiene products. The virus may have inspired deeper and longer-lasting changes in consumer behavior, too. Accenture reported people are favoring healthier lifestyles, consuming goods more conscientiously, and showing a preference for locally-sourced goods.
  • Healthcare, drug development/delivery, and medical equipment. Last Friday, 316 COVID-19 treatments and 212 vaccines were in development around the world, reported the Milliken Institute. In some places, humans are collaborating with artificial intelligence to streamline drug discovery processes. Demand for telehealth services has increased dramatically. So has demand for personal protective equipment, reported Pankaj Singh of Plastics Today.

Throughout 2020, investors’ enthusiasm has pushed markets higher. However, concerns about a variety of issues have dampened enthusiasm in recent weeks. Last Friday, Ben Levisohn of Barron’s reported:

“In a week filled with headlines about government stimulus (or the lack thereof), Supreme Court nominations, the election, the gain in the Nasdaq…suggests that it was the fear of another COVID-19 wave that really got the market down. And for good reason. The week began with the U.K. talking about a second shutdown and ended with all of Europe facing down a second wave of infection…In the U.S., the number of cases is rising and the death toll passed 200,000 midweek…”

Many of these concerns aren’t likely to dissipate soon, and volatility is likely to continue.

Last week, the Standard & Poor’s 500 Index and Dow Jones Industrial Average lost value, while the Nasdaq Composite gained value.

Preparing for A pandemic halloween. In many neighborhoods across the United States, Halloween decorations have begun to appear. If you’ve been wondering whether Halloween celebrations and trick-or-treating are possible when the COVID-19 virus is still spreading across the country and the world, you may be interested in the Halloween guidelines issued by the Centers for Disease Control:

Low risk activities:

  • Carving or decorating pumpkins at home and displaying them
  • Carving or decorating pumpkins outside, at a safe distance, with neighbors or friends
  • Decorating your house, apartment, or living space
  • Holding a virtual Halloween costume contest
  • Having a Halloween movie night at home with your family or roommates
  • Having a Halloween scavenger hunt with lists of Halloween-themed things to look for while walking outdoors, at a safe distance from other participants
  • Having a scavenger-hunt style trick-or-treat event with your household members in or around your home instead of trick-or-treating from house to house


Moderate risk activities:

  • Participating in one-way trick-or-treating. Individually wrapped treats are lined up for families to take while remaining at a safe social distance (end of a driveway or at the edge of a yard)
  • Small group, outdoor, open-air costume parades or parties with participants remaining at safe social distances (six feet apart)
  • Going to an open-air, one-way, walk-through haunted forest where appropriate mask use is enforced, and people can remain more than six feet apart (if screaming is likely, distances should be increased)
  • Having an outdoor Halloween movie night with local family friends with people spaced at least six feet apart (again, if screaming is likely, distances should be increased)


With a little planning, everyone can have a safe and fun Halloween.

Weekly Focus – Think About It
“In three words, I can sum up everything I’ve learned about life. It goes on. In all the confusions of today, with all our troubles…with politicians and people slinging the word fear around, all of us become discouraged…tempted to say this is the end, the finish. But life – it goes on. It always has. It always will. Don’t forget that.”
–Robert Frost, Poet, on his 80th birthday in 1954

Most Popular Financial Stories

A.I. Is Everywhere

A.I. Is Everywhere

If you've heard CEOs mention "A.I." multiple times during second-quarter conference calls or on the news, you're not imagining it. There have been an astounding 1,072...

read more
Happy Independence Day

Happy Independence Day

The Fourth of July is just ahead – a chance for us all to get together and celebrate what makes America so special. As Americans, we have the liberty to act, speak, think,...

read more


Investment advice offered through Research Financial Strategies, a registered investment advisor.
* This newsletter and commentary expressed should not be construed as investment advice.
* Government bonds and Treasury Bills are guaranteed by the U.S. government as to the timely payment of principal and interest and, if held to maturity, offer a fixed rate of return and fixed principal value.  However, the value of fund shares is not guaranteed and will fluctuate.
* Corporate bonds are considered higher risk than government bonds but normally offer a higher yield and are subject to market, interest rate and credit risk as well as additional risks based on the quality of issuer coupon rate, price, yield, maturity, and redemption features.
* The Standard & Poor’s 500 (S&P 500) is an unmanaged group of securities considered to be representative of the stock market in general. You cannot invest directly in this index.
* All indexes referenced are unmanaged. The volatility of indexes could be materially different from that of a client’s portfolio. Unmanaged index returns do not reflect fees, expenses, or sales charges. Index performance is not indicative of the performance of any investment. You cannot invest directly in an index.
* The Dow Jones Global ex-U.S. Index covers approximately 95% of the market capitalization of the 45 developed and emerging countries included in the Index.
* The 10-year Treasury Note represents debt owed by the United States Treasury to the public. Since the U.S. Government is seen as a risk-free borrower, investors use the 10-year Treasury Note as a benchmark for the long-term bond market.
* Gold represents the afternoon gold price as reported by the London Bullion Market Association. The gold price is set twice daily by the London Gold Fixing Company at 10:30 and 15:00 and is expressed in U.S. dollars per fine troy ounce.
* The Bloomberg Commodity Index is designed to be a highly liquid and diversified benchmark for the commodity futures market. The Index is composed of futures contracts on 19 physical commodities and was launched on July 14, 1998.
* The DJ Equity All REIT Total Return Index measures the total return performance of the equity subcategory of the Real Estate Investment Trust (REIT) industry as calculated by Dow Jones.
* The Dow Jones Industrial Average (DJIA), commonly known as “The Dow,” is an index representing 30 stock of companies maintained and reviewed by the editors of The Wall Street Journal.
* The NASDAQ Composite is an unmanaged index of securities traded on the NASDAQ system.
* International investing involves special risks such as currency fluctuation and political instability and may not be suitable for all investors. These risks are often heightened for investments in emerging markets.
* Yahoo! Finance is the source for any reference to the performance of an index between two specific periods.
* Opinions expressed are subject to change without notice and are not intended as investment advice or to predict future performance.
* Economic forecasts set forth may not develop as predicted and there can be no guarantee that strategies promoted will be successful.
* Past performance does not guarantee future results. Investing involves risk, including loss of principal.
* The foregoing information has been obtained from sources considered to be reliable, but we do not guarantee it is accurate or complete.
* There is no guarantee a diversified portfolio will enhance overall returns or outperform a non-diversified portfolio. Diversification does not protect against market risk.
* Asset allocation does not ensure a profit or protect against a loss.
* Consult your financial professional before making any investment decision.
* To unsubscribe from the Weekly Market Commentary please reply to this e-mail with “Unsubscribe” in the subject.

Very Important

Very Important

Dear Clients, Soon-to-Be-Clients and friends,

Well, it looks like the party’s over. The S&P 500 has plunged through several levels of support. Take a look. Here’s the chart.

This chart shows the S&P when it was 3,332. Now, as I write, it sits uncomfortably at 3,319, down 1.12%. The DOW is down .88%. The Nasdaq has plunged 1.30%.

Yesterday, we took steps to protect our client portfolios. We have experienced extraordinary gains in our growth portfolios, but believe that the market is steadily approaching a strong market downturn. Therefore, we bought a rather significant position for all accounts in SQQQ, which gives us 3x the inverse of the QQQ (the Nasdaq). Thus, right now, the Nasdaq is down 1.30%. Our SQQQ position is up 4.01% on the day.

That gain will shield losses in long positions.

You might ask why we haven’t bailed on long positions. Well, we did flush out all positions in TQQQ (a long position 3x the gain in the QQQ). Also, you might have noticed that over the past week, we have taken profits on some long positions to protect your gains and to raise enough cash to take on the SQQQ short position yesterday.

But getting out of long positions can often be the wrong move. The markets have a nasty habit of forming what are called “whiplashes.” They can drop, and make everyone’s gut drop, and then turn back up on a dime. Those who’ve exited must then scramble to get back in.  

So, we prefer to use our system of basically neutralizing any gains or losses in turbulent stock markets. It has worked in the past. It will work in the future.

It’s hard to say where the markets will go from here. All three main indexes have built out chart patterns known as “Head & Shoulders” (not the shampoo!). These structures are always bearish and point to a decline of about 10%. The S&P could hit 3,000.

The key thing though is this: We are watching. We are ready to move when our indicators tell us to. We are using our discipline, and, we think, that’s why you want us to do what we do. It is extremely hard for an individual investor to have a system and truly stick to it.

So, sit back. Relax. Watch the elections unfold. They should provide quite a show. We do have some opinions on the impact the elections might have on the markets. Watch your inbox. We’ll send an election update soon.

 Cordially yours,

 Jack Reutemann

Market Commentary

Market Commentary

How Are Your Investments Doing Lately?  Receive A Free, No-Obligation 2nd Opinion On Your Investment Portfolio >

Last week, the Nasdaq Composite Index set another record.

So far, 2020 has been memorable for many reasons, not the least of which is the incredible speed at which some events have been occurring in financial markets. This year, we’ve experienced:

  • The end of the longest U.S. stock bull market in history
  • A global stock market crash
  • The shortest U.S. stock bear market in history
  • Multiple record highs for major U.S. stock indices

Last week, we witnessed the swiftest correction on record as the Nasdaq fell by 10 percent in just three days. By the end of the week, the Index had recouped some losses and finished down 4.1 percent. The Standard & Poor’s 500 Index and Dow Jones Industrial Average also finished the week lower.

It would be gratifying if the recent drop in share price steadied U.S. stock markets. However, we are likely to see stocks remain volatile through the end of 2020. The Economist explained:

“Because of the influential role of turbocharged retail investment, prices can be expected to remain choppy. Moreover, the market is entering a period where typical COVID-19-related volatility may be exacerbated by the twists and turns of America’s presidential election.

“That said, much of the tech recovery from the lows in March was rooted in fundamental shifts, like policy interventions, or pandemic-prompted changes to consumer behavior, such as online shopping, that have helped firms…Even if the giddy obsession with tech firms exhibited during the summer fades, there may be little reason for investors to throw in the beach towel yet.”

This is a good time to take a gut check and make sure your asset allocation aligns with your financial goals and your response to market volatility.

Go fly a kite. Wind is one of the fastest growing energy sources in the United States. In 2019, wind generated 7.2 percent of the nation’s electricity, powering 27.5 million homes, reported the American Wind Energy Association. Wind power has become a major provider of electricity in:

  • Iowa generating 41.9 percent of electricity
  • Kansas generating 41.4 percent of electricity
  • Oklahoma generating 34.5 percent of electricity
  • North Dakota generating 26.8 percent of electricity
  • South Dakota generating 23.9 percent of electricity
  • Maine generating 23.6 percent of electricity

As with many things, wind farms have pros and cons. On the plus side, wind energy is a renewable energy source that generates income and tax revenue in rural areas. In the negative column, construction can damage drainage systems and hurt crop production. In addition, towering turbines can catch fire, throw ice, cause headaches (literally), and create other issues, reported Slate.

A new wind energy option may do away with some of those negatives in some locations. Wind kites deliver power and have a far smaller profile than many turbines. Fast Company explained:

“As the kite flies autonomously, driven by the wind, eight small onboard rotors turn and generate energy that is sent down a thin tether back to the ground…it does the same work as the tips of the blades on large wind turbines, which convert the most energy in the system because they move the greatest distance as they’re pushed by the wind. But the new technology, which came out of research at the Technical University of Munich, does that work without the same need for massive infrastructure.”

Wind kites may be well-suited to islands and other areas where importing turbines is not feasible. They may also be a sound option in hurricane-prone regions since kites can be lowered to the ground. Best of all, kites use 10 times less material, so costs are significantly reduced.

Weekly Focus – Think About It
“We are moving so fast that when plans are being made to perform some great feat, these plans are broken into by a youth who enters and says, “I have done it.” This is exactly what Cook did for Arctic exploration.” (April 1914)
 –Elbert Hubbard, Writer and publisher

Most Popular Financial Stories

A.I. Is Everywhere

A.I. Is Everywhere

If you've heard CEOs mention "A.I." multiple times during second-quarter conference calls or on the news, you're not imagining it. There have been an astounding 1,072...

read more
Happy Independence Day

Happy Independence Day

The Fourth of July is just ahead – a chance for us all to get together and celebrate what makes America so special. As Americans, we have the liberty to act, speak, think,...

read more


Investment advice offered through Research Financial Strategies, a registered investment advisor.
* This newsletter and commentary expressed should not be construed as investment advice.
* Government bonds and Treasury Bills are guaranteed by the U.S. government as to the timely payment of principal and interest and, if held to maturity, offer a fixed rate of return and fixed principal value.  However, the value of fund shares is not guaranteed and will fluctuate.
* Corporate bonds are considered higher risk than government bonds but normally offer a higher yield and are subject to market, interest rate and credit risk as well as additional risks based on the quality of issuer coupon rate, price, yield, maturity, and redemption features.
* The Standard & Poor’s 500 (S&P 500) is an unmanaged group of securities considered to be representative of the stock market in general. You cannot invest directly in this index.
* All indexes referenced are unmanaged. The volatility of indexes could be materially different from that of a client’s portfolio. Unmanaged index returns do not reflect fees, expenses, or sales charges. Index performance is not indicative of the performance of any investment. You cannot invest directly in an index.
* The Dow Jones Global ex-U.S. Index covers approximately 95% of the market capitalization of the 45 developed and emerging countries included in the Index.
* The 10-year Treasury Note represents debt owed by the United States Treasury to the public. Since the U.S. Government is seen as a risk-free borrower, investors use the 10-year Treasury Note as a benchmark for the long-term bond market.
* Gold represents the afternoon gold price as reported by the London Bullion Market Association. The gold price is set twice daily by the London Gold Fixing Company at 10:30 and 15:00 and is expressed in U.S. dollars per fine troy ounce.
* The Bloomberg Commodity Index is designed to be a highly liquid and diversified benchmark for the commodity futures market. The Index is composed of futures contracts on 19 physical commodities and was launched on July 14, 1998.
* The DJ Equity All REIT Total Return Index measures the total return performance of the equity subcategory of the Real Estate Investment Trust (REIT) industry as calculated by Dow Jones.
* The Dow Jones Industrial Average (DJIA), commonly known as “The Dow,” is an index representing 30 stock of companies maintained and reviewed by the editors of The Wall Street Journal.
* The NASDAQ Composite is an unmanaged index of securities traded on the NASDAQ system.
* International investing involves special risks such as currency fluctuation and political instability and may not be suitable for all investors. These risks are often heightened for investments in emerging markets.
* Yahoo! Finance is the source for any reference to the performance of an index between two specific periods.
* Opinions expressed are subject to change without notice and are not intended as investment advice or to predict future performance.
* Economic forecasts set forth may not develop as predicted and there can be no guarantee that strategies promoted will be successful.
* Past performance does not guarantee future results. Investing involves risk, including loss of principal.
* The foregoing information has been obtained from sources considered to be reliable, but we do not guarantee it is accurate or complete.
* There is no guarantee a diversified portfolio will enhance overall returns or outperform a non-diversified portfolio. Diversification does not protect against market risk.
* Asset allocation does not ensure a profit or protect against a loss.
* Consult your financial professional before making any investment decision.
* To unsubscribe from the Weekly Market Commentary please reply to this e-mail with “Unsubscribe” in the subject.


Investment advice offered through Research Financial Strategies, a registered investment advisor.


https://www.wsj.com/articles/global-markets-calmer-after-two-hectic-days-11583899913 (or go to https://peakcontent.s3-us-west-2.amazonaws.com/+Peak+Commentary/09-14-20_WSJ-Dow_Jones_Industrial_Averages_11-Year_Bull_Run_Ends-Footnote_1.pdf)
https://www.bbc.com/news/51860099
https://www.reuters.com/article/us-usa-stocks-s-p500-bear-graphic/say-goodbye-to-the-shortest-bear-market-in-sp-500-history-idUSKCN25E2R9
https://www.cnbc.com/2020/08/28/stock-market-today-live.html
https://www.barrons.com/articles/the-market-is-a-bubble-but-that-doesnt-mean-troubleyet-51599862332?mod=hp_LEAD_3 (or go to https://peakcontent.s3-us-west-2.amazonaws.com/+Peak+Commentary/09-14-20_Barrons-Yes_Its_a_Stock_Market_Bubble-That_Doesnt_Mean_Trouble_for_Investors_Just_Yet-Footnote_5.pdf)
https://www.barrons.com/articles/it-doesnt-matter-if-its-trump-or-bidennext-year-looks-rocky-for-the-stock-market-51599868976?refsec=the-trader (or go to https://peakcontent.s3-us-west-2.amazonaws.com/+Peak+Commentary/09-14-20_Barrons-Next_Year_Looks_Rocky_for_the_Stock_Market_No_Matter_Who_Wins_the_Election-Footnote_6.pdf)
https://www.economist.com/finance-and-economics/2020/09/12/beware-the-power-of-retail-investors (or go to https://peakcontent.s3-us-west-2.amazonaws.com/+Peak+Commentary/09-14-20_TheEconomist-Beware_the_Power_of_Retail_Investors-Footnote_7.pdf)
https://www.awea.org/wind-101/basics-of-wind-energy/wind-facts-at-a-glance
https://slate.com/technology/2017/08/why-farmers-in-iowa-hope-wind-energy-will-blow-over.html
https://www.fastcompany.com/90545456/these-kites-generate-wind-power-by-flying-through-the-air
https://books.google.com/books/about/The_Philistine.html?id=6UM6AAAAMAAJ (or go to https://peakcontent.s3-us-west-2.amazonaws.com/+Peak+Commentary/09-14-20_Book_Excerpt-The_Philistine-Footnote_11.pdf)


Very Important

A Bump in the Road?​

End-of-Summer Market Update

Dear Friend,

Speed bump, stop sign, or red light? That’s the question many of us are asking.

Let me explain. After cruising for the past five months, the markets screeched to a halt on September 3, the Dow dropping over 800 points, and the Nasdaq plunging nearly 5%.1 All told, it was one of the worst trading days for stocks since the pandemic-driven panic of March. The volatility continued the next day, albeit at lower levels.

So, what does it mean? Was Thursday’s selloff just a short-term blip—the equivalent of hitting a speed bump? Or was it the beginning of a market correction? If so, how long of a correction? Are we merely coming to a stop sign, or will we hit a red light?

Unfortunately, market signals are never as easy to interpret as road signs. But as we start winding down this bewildering year, investors will be gripping their steering wheels ever more tightly. That’s because they’re all trying to determine whether the markets will end the year on cruise control…or in full reverse.

Whenever you drive to a destination, it’s always good to familiarize yourself with the road beforehand. So, as this crazy summer draws to a close, let’s look at the different scenarios we could experience over the next few months.

As a heads up, we’re going to cover a lot of ground in this message. I believe my most important responsibility is to keep you not only informed about what’s going on in the markets but also prepared for what may come in the future. In this message, I will try to do both. Let’s dive in.

Speed Bumps

Between April and May, all three major US stock indexes—the Dow, the S&P 500, and the NASDAQ—climbed for five consecutive months. The S&P 500, for example, rose 60% over that period.2

Every so often, though, the markets experience a dramatic one- or two-day selloff. When those selloffs come during the middle of a major rally, like the one we’ve been experiencing, investors wonder whether it’s the beginning of a market correction. (A correction, remember, is when the markets fall at least 10% from their recent highs.)

Market corrections are relatively common. On average, we’ll see one at least once every 1 to 2 years.3 But more often, these selloffs are not the beginning of anything at all. They are simply speed bumps, and while they may seem random, there are usually underlying reasons for them.

For example, let’s take what happened on September 3 and assume it’s only a speed bump. Why did it happen? A closer look at which stocks fell may provide some answers. Specifically, tech stocks, including big names like Apple and Facebook, were the ones that suffered the most—just as those same stocks have largely fueled the markets rally. (More on this in a moment.) There are a few possible reasons for this. One is that many investors may simply have been cashing out of tech stocks to realize their gains. Another reason is that, because prices for tech stocks have risen so high, many traders may feel there’s simply no justification for plowing more money into them. When that happens, traders and short-term investors often move their money into other sectors they feel are undervalued.

In other words, the shudder that went through the markets is like the one you feel when changing gears in an old car. If that’s the case, the selloff was likely just a speed bump. A short pause for investors to take a breath before the markets resume their climb.

Here’s another reason why many selloffs are just speed bumps: The Federal Reserve. After the country went into lockdown, the Federal Reserve did many things to prop up the economy.4 First, it lowered interest rates to historic lows. This was to lower the cost of borrowing on mortgages, auto loans, home equity loans, and others—a key step to keep the economy moving. Second, the Fed launched a massive bond-buying program. This is another way to keep interest rates low. The Fed has also been lending money to securities firms, banks, major employers, and some small businesses using a variety of means.

These are all familiar tactics for anyone who was paying attention during the Great Recession. Then, as now, the Fed’s actions indirectly propelled the stock market. That’s because lower interest rates prompt increased spending, which in turn causes stock prices to rise. And, perhaps more importantly, the Fed’s massive increase in the money supply juices the stock market. After all, that new money wants a home, it wants a return. It looks at bonds and says, No, no return there. And so it rushes into the US stock market.

As long as the Fed keeps its stimulus programs in place, stocks will continue to be one of the most attractive places for people to put their money. And since the economy remains on very shaky ground, it’s unlikely the Fed will pull back any time soon. “Don’t fight the Fed,” investors are often counseled. Thanks in large part to the Federal Reserve, the stock market continues to be the shortest, surest road for investors to travel. That’s why many selloffs are nothing more than speed bumps.

Stop Signs

Of course, sometimes a selloff is more than just a speed bump. Sometimes, it’s like a neon light flashing: STOP SIGN AHEAD.

When this happens, Wall Street-types like to call it a market correction—a decline of 10% or more from a recent high. There are many reasons why corrections occur. One thing many corrections have in common, though, is they come after months of major market growth. When prices rise extremely high, extremely fast, it’s as if the markets have “overheated” and need to cool off.

It wouldn’t be a surprise if that’s what we’re seeing right now. Again, the S&P 500 rose 60% between March 23 (its most recent low) and September 2 (its most recent high).2 In that same period, the tech-heavy NASDAQ rose roughly 75%!5 Those are staggering numbers. One could argue we’re overdue for a correction.

Speaking of tech-heavy, let’s talk about technology stocks for a moment. When the markets plummeted in March, these stocks were one of the few safe havens around—and they’ve also been the best performers since then. That’s no surprise. At a time when most Americans were largely confined to their homes, it was our technology—from our iPhones to Zoom, from Google to Netflix—that kept the economy going. But remember how I said the S&P rose 60%? Peek under the hood and you’ll see those numbers were driven by two sectors: technology stocks and consumer discretionary stocks. (Think Nike, McDonald’s, Home Depot, etc.) Other sectors either performed much lower or are still in the red. So when we say the markets have recovered well, what we’re really saying is that the top sectors have performed enough to make up for those still struggling.

It’s one of the many reasons the stock market simply isn’t a reliable barometer for the overall economy.

What does this have to do with a market correction? A lot, actually. It’s all thanks to these two terms: capitalization and weighting. Remember, the S&P 500 is an index, not the actual stock market itself. It’s essentially a collection of the five hundred largest companies listed on U.S. stock exchanges, which is where stocks are traded. More specifically, the S&P is a capitalization-weighted index. Without getting too technical, that means the largest companies make up the largest percentage of the index. For example, Amazon, Apple, Microsoft, Facebook, and Google—just five companies—make up 20% of the index!6

Look at that list of companies again. Notice anything about it? Yep, you guessed it: four of them are tech companies. In fact, if we break down the S&P 500 by sector, you’d notice that technology dominates the S&P 500. Actually, let’s do that right now.7

As you can see, the S&P 500 is currently overweighted to technology stocks, to the tune of 27.4%. So if tech stocks were to endure any type of prolonged selloff, that would have a major impact on the S&P 500 as a whole—and could well lead to an overall market correction.

Red Lights

Some market corrections last only a few days or weeks. When that happens, it’s like coming to a stop sign. A brief pause, and then we continue our journey.

But some corrections last longer than that. According to one report, the average correction lasts around four months. When that happens, it’s more like hitting one of those annoyingly-long red lights, just as you’re heading home and the sun is in your eyes. The kind that makes you think, “What does the universe have against me today?”

Before I go on, note that I’m not predicting that is what’s happening here. I don’t try to predict the future—that’s a game for fortune-tellers. Instead, I try to prepare for the future. And to be frank, it’s possible we could see a longer correction in the not-to-distant future. That’s because the future contains a lot of question marks, any of which could prompt the markets to pull back.

For starters, there’s the economy. While the markets enjoyed a V-shaped recovery after March, the overall economy has not. Things are improving, but still a long way from healthy. For example, the U.S. added 1.4 million jobs in August alone…but it’s still down 11.5 million jobs since the pandemic began.8 In other words, things are much less bad than before—but they’re still historically bad. The markets have hummed along despite all this, but at some point, it’s possible the economic reality could drag stock prices down.

At the same time, we’re seeing renewed Trade War fears with China. We’re also only two months away from a bitter presidential election. Historically, the markets don’t really care who sits in the White House, so there’s no reason you should let the election impact your financial thinking. (I’ll have more information on this in the coming weeks.) But in the runup to the election, we can certainly anticipate more volatility as people worry about who will win and what it means.

And of course, there’s COVID-19. We’re all sick of hearing about it, but it’s still a fact of life and will continue to be so for some time. Should cases surge in tandem with the upcoming flu season, the markets may retract into their shell.

In short, it’s certainly possible that we see a market correction over the next few months. But whether we do or not, it’s important to remember that corrections are inevitable and temporary. Corrections can even create opportunities for the future, as they open the door for investors to pick good companies at lower prices.

So what do we do now?

Remember: We can’t predict the future. But we can prepare for it. The fact is, we’re on a road we’ve never been on before—as investors and as a country. In real life, whenever we drive on an unfamiliar road, we drive cautiously, keeping our eye out for hazards. The same is true with investing. Speed bumps are only an annoyance when we go over them too fast. Stop signs and red lights are only dangerous when we speed past them. That’s why we use technical analysis to determine which way the markets are trending. By doing that, we can spot these road blocks ahead of time and slow down (or pull off to the side of the road) accordingly.

Unlike buy-and-hold investors, we don’t need to fear the occasional bout of market volatility. Because we follow set rules for when to enter and exit the markets, we don’t mind stopping occasionally. We are prepared to play defense or even move to cash at any time. That’s what helped us when the markets crashed in March. It’s what will help us moving forward.

Should a downturn happen, your portfolio is prepared. Now we just need to prepare ourselves mentally and emotionally in case there are stop signs and red lights ahead. And if it turns out to be a speed bump? That’s fine, too. We were already driving the speed limit.

As always, my team and I will keep a close eye on the road ahead. In the meantime, enjoy the end of your summer. Please feel free to contact me if you ever have any questions or concerns. I am delighted to be of service in any way I can.

Sincerely,

Jack Reutemann, Jr. CLU, CFP®

SOURCES
1 “Dow and Nasdaq plummet in the worst day since June,” CNN Business, September 3, 2020. https://www.cnn.com/2020/09/03/investing/nasdaq-selloff-stock-market-today/index.html
2 “S&P 500 Historical Prices,” The Wall Street Journal, https://www.wsj.com/market-data/quotes/index/SPX/historical-prices
3 “Here’s how long stock market corrections last,” CNBC, February 27, 2020. https://www.cnbc.com/2020/02/27/heres-howlong-stock-market-corrections-last-and-how-bad-they-can-get.html
4 “What’s the Fed doing in response to the COVID-19 crisis?” Brookings, July 17, 2020. https://www.brookings.edu/research/fed-response-to-covid19/
5 “Nasdaq historical prices,” The Wall Street Journal, https://www.wsj.com/market-data/quotes/index/COMP/historical-prices
6 “5 companies now make up 20% of the S&P 500,” Markets Insider, April 27, 2020. https://markets.businessinsider.com/news/stocks/sp500-concentration-large-cap-bad-sign-future-returns-effect-market-2020-4- 1029133505#
7 “U.S. Stock Market Sector Weightings,” Siblis Research, June 30, 2020. https://siblisresearch.com/data/sp-500-sectorweightings/
8 “U.S. adds 1.4 million jobs in August,” CNN Business, September 4, 2020. https://www.cnn.com/2020/09/04/economy/jobsreport-august-2020/index.html​​

6Lc_psgUAAAAAA9c7MediJBuq3wAxIyxDSt73c9j