Rate Cut Ahead: Is Your Income Strategy Ready?

Rate Cut Ahead: Is Your Income Strategy Ready?
With the Federal Reserve now signaling an 87% chance of cutting interest rates at its upcoming meeting, it is crucial to assess how this shift could impact your financial future—especially if you rely on your portfolio for income.
The Impact: Falling interest rates often mean lower yields on common investments like new bonds and CDs. This can significantly reduce the income your portfolio generates over time, potentially tightening your cash flow. Consider this: a $300,000 investment earning 5% today would generate $7,500 less per year if renewed at a lower rate of 2.5%.
Confidence Check & Next Steps
As the year winds down, it's the perfect time to ensure your plan is positioned to succeed through this change. I'm offering a complimentary, no-obligation review where we can:
  • Stress-test your income strategy against a falling interest-rate environment.
  • Assess your investment risk to ensure your balance of growth and stability aligns with your comfort level and long-term goals.
  • Explore tax-planning opportunities to help optimize withdrawals and potentially offset lower investment income.
Let's make sure your plan is on solid ground. Simply contact us to schedule your free retirement review.

The Shifting Landscape of U.S. Residential Real Estate

A Decline in First-Time Homeownership and a Surge in Rentals
The American housing market is experiencing a notable transformation, characterized by a significant downturn in first-time home purchases and an unprecedented expansion of the rental sector. This shift is largely attributed to a challenging environment marked by elevated borrowing costs and escalating property values, which are increasingly keeping prospective homeowners in rental accommodations.

Recent industry figures indicate a substantial reduction in the number of individuals buying their first homes. Last year, the count of new homebuyers stood at 1.1 million, a decrease of 380,000 from the previous year and nearly half of what has historically been observed. Projections for the current year suggest an even steeper decline, with sales data through May pointing to a total of approximately 40.3 million home sales across the nation. This would represent a further drop from last year's figures and the lowest sales volume recorded in the U.S. since 1995. This sales slowdown is particularly evident in the market segment for properties priced below $500,000, which traditionally attracts first-time purchasers.

The trend of diminishing new buyers is also reflected in residential construction activity. In May, new home sales saw a 6% decrease compared to the same month in the prior year. Developers often rely on demand for starter homes from first-time buyers, who historically constitute about 40% of new home sales. Consequently, a reduction in new construction suggests a corresponding decrease in the pool of new buyers seeking such properties.

As a direct outcome of these dynamics, the number of households opting for rentals has surged, reaching an all-time high of 46 million across the U.S. The financial barrier to homeownership has become considerably more formidable. Analysis from academic institutions highlights that an individual seeking to purchase a median-priced home today would require an annual income of $127,000 to manage the associated mortgage payments, a sharp increase from $79,000 just a few years prior in 2021. Alarmingly, only a fraction of the current renter population, approximately 6 million out of 46 million, meets this income threshold. This disparity is particularly pronounced among younger generations, with Gen Z and Millennials exhibiting lower homeownership rates at their current life stages compared to Baby Boomers at similar points in their lives.

Unless there are significant adjustments in mortgage interest rates or a substantial depreciation in property values—scenarios that might typically accompany an economic downturn—the aspiration of homeownership is likely to remain out of reach for a considerable segment of the American population for the foreseeable future.

Stock Pullbacks Are Helpful, Not Hurtful

Do me a favor: print the chart in this email and pin it to your wall. I want you to have a constant reminder that stock prices see pullbacks several times during the year.

It’s a normal, healthy part of the investing cycle. Is it unsettling? Very! But when prices turn volatile, I want you to slip into your “Been there, done that” t-shirt.

The second half of February was difficult for investors–and the first part of March was not much better either. There were waves of unsettling news about tariffs, inflation, economic growth, and geopolitical events. 

But was the selling unexpected? Not really. Since 1950, history shows that in post-election years, February has been the worst month for stock prices.

(Spoiler alert: Post-1950, June, August, and September also show poorly in post-election years. So mark your calendar.)

It's important to remember that past performance does not guarantee future results. Stock prices will fluctuate as market conditions change. So, while we can look to history for trends, it’s uncertain how the rest of 2025 will unfold. 

But if you are getting anxious watching the daily price moves on Wall Street, please call me. I can tell you how I manage the ups and downs.

Carson Investment Research, February 5, 2024

Inflation Drops; Fed Changes Outlook

“It ain’t over ‘til it’s over.” Words of wisdom from baseball legend Yogi Berra. And words that Fed Chair Jerome Powell has taken to heart.

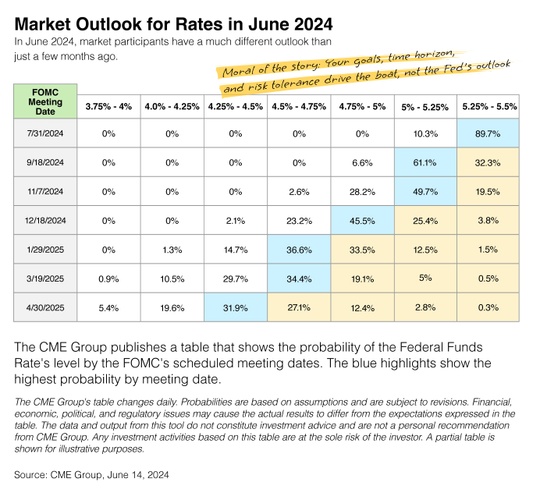
“Inflation has eased over the past year but remains elevated,” Powell said following the Fed’s June meeting. In other words, “it ain’t over ‘til it’s over.” The Fed wants to see more progress toward the Committee’s 2 percent inflation objective before considering any changes to monetary policy.

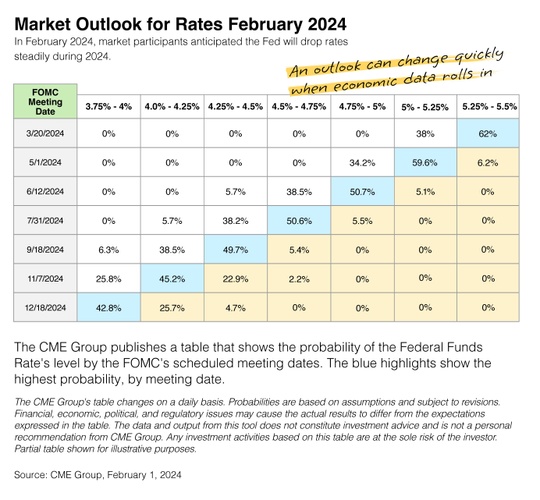
Recall that just a few months ago, the Fed seemed prepared to cut rates three times in 2024. However, an uptick in inflation in Q1 forced them to revise their outlook. At the June meeting, Fed officials anticipate cutting short-term interest rates just once this year.1,2

The Fed’s about-face serves as a good lesson for everyone.

Changes in your goals, time horizon, and risk tolerance should drive portfolio adjustments rather than forecasts and best guesses. The economy changes. Markets shift. And the Federal Reserve will adjust its strategy in response to what’s happening.

When I say “staying the course” and don’t overreact, it’s because I’ve experienced several economic cycles that take longer than expected to resolve. I’ve also seen others take shorter than expected to conclude. So today, I ask myself, “Is the Fed going to stick to its one-cut strategy or update its approach at the next meeting?” Recent history would suggest it’s about a 50/50 chance!

Our strategy isn’t dependent on anything the Fed does–or doesn’t do. Let’s stay the course and remember, “It ain’t over ‘til it’s over.”

The Cost of Procrastination

Some of us share a common experience. You're driving along when a police cruiser pulls up behind you with its lights flashing. You pull over, the officer gets out, and your heart drops.

“Are you aware the registration on your car has expired?”

You've experienced one of the costs of procrastination.

"Procrastination can cause missed deadlines, missed opportunities, and just plain missing out."


Procrastination is avoiding a task that needs to be done—postponing until tomorrow what could be done today. Procrastinators can sabotage themselves. They often put obstacles in their own path. They may choose paths that hurt their performance.

Though Mark Twain famously quipped, “Never put off until tomorrow what you can do the day after tomorrow,” we know that procrastination can be detrimental, both in our personal and professional lives. Problems with procrastination in the business world have led to a sizable industry in books, articles, workshops, videos, and other products created to deal with the issue. There are a number of theories about why people procrastinate, but whatever the psychology behind it, procrastination may cost money—particularly when investments and financial decisions are put off.

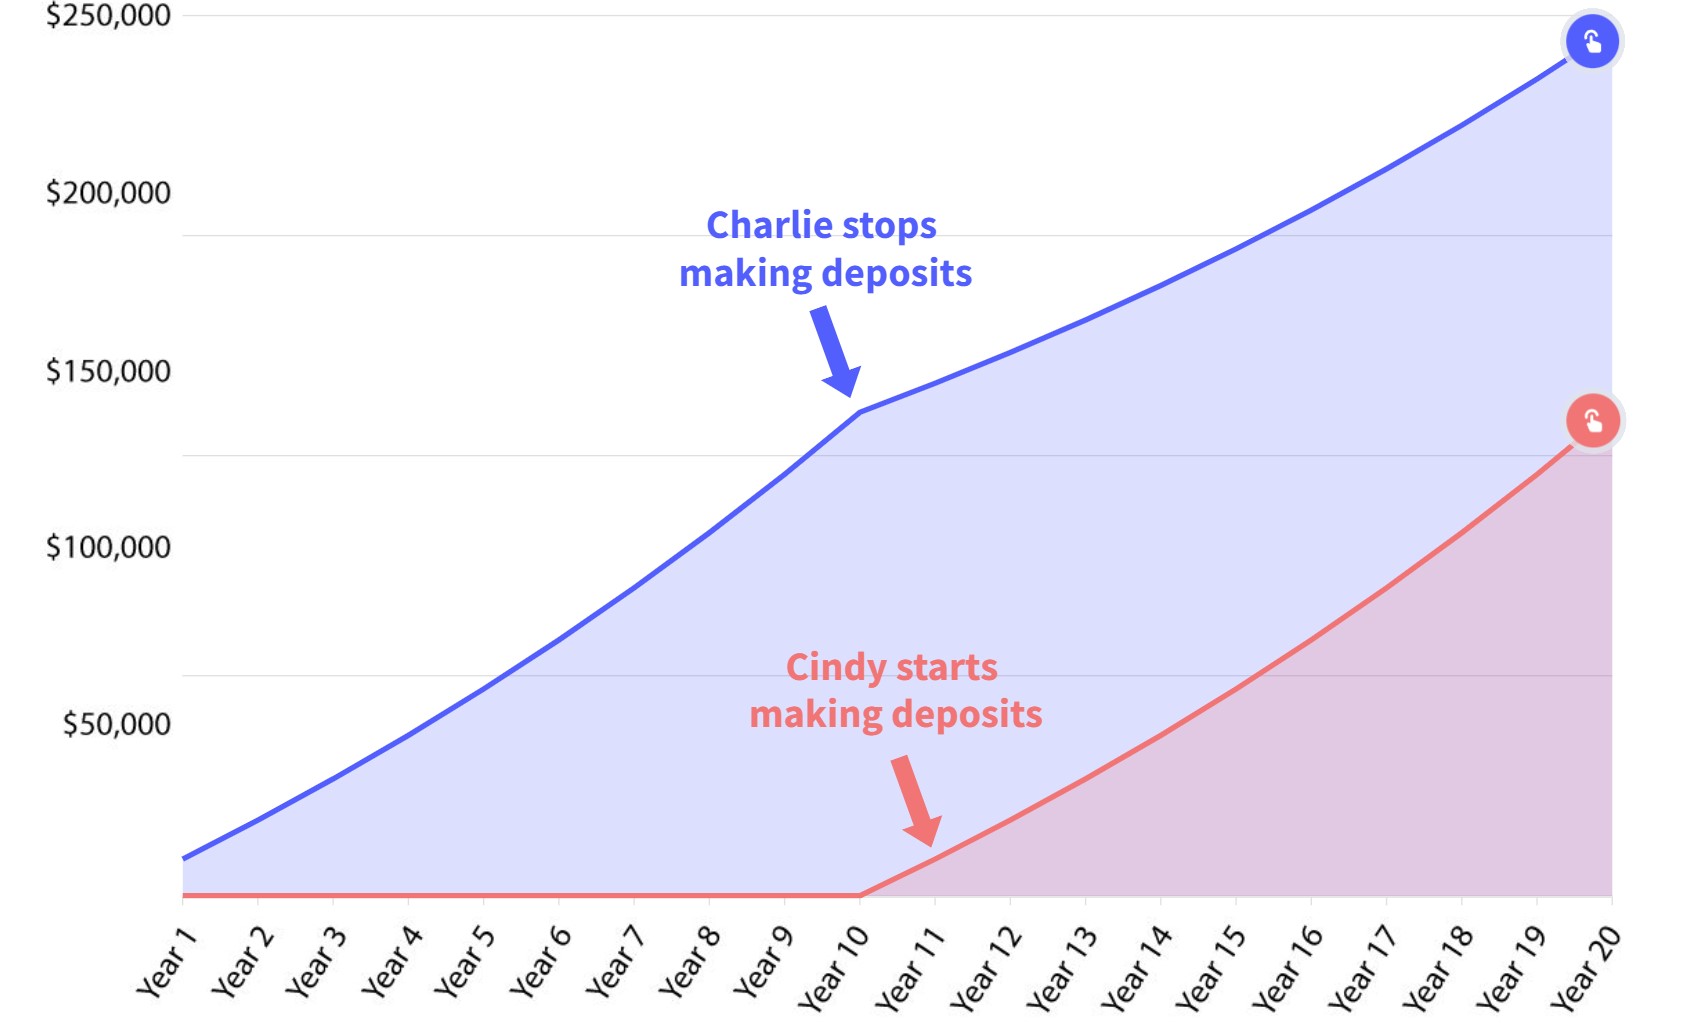
As the illustration below shows, putting off investing may put off potential returns.

If you have been meaning to get around to addressing some part of your financial future, maybe it's time to develop a strategy. Don't let procrastination keep you from pursuing your financial goals. This also applies to college funds for kids and grandchildren too. The sooner you start, the more time for compound growth of investment accounts.

Early Bird

Let's look at the case of Cindy and Charlie, who each invest $100,000.

Charlie immediately begins depositing $10,000 a year in an account that earns a 6% rate of return. Then, after 10 years, he stops making deposits.

Cindy waits 10 years before getting started. She then starts to invest $10,000 a year for 10 years into an account that also earns a 6% rate of return.

Cindy and Charlie have both invested the same $100,000. However, Charlie's balance is higher at the end of 20 years because his account has more time for the investment returns to compound.

This is a hypothetical example of mathematical compounding. It’s used for comparison purposes only and is not intended to represent the past or future performance of any investment. Taxes and investment costs were not considered in this example. The results are not a guarantee of performance or specific investment advice. The rate of return on investments will vary over time, particularly for long-term investments. Investments that offer the potential for high returns also carry a high degree of risk. Actual returns will fluctuate. The type of strategies illustrated may not be suitable for everyone.

Special Market Update

We closed out the QQQ (NASDAQ 100 ETF) long/short positions yesterday.  This morning we just sold RSP, ROBO and UBOT due to weakness in their respective sectors.  We are still holding the S&P-500 long/short combo to neutralize our models and to not incur capital gains on recent profits.  If you have any prospects, friends, relatives, etc., that are 100% long in a "pie chart" investing style, you really need to get their attention now. 

Yesterday, I spoke with a client who gave me part of her money as a test on August 18, 2022.  She is +2.90% through yesterday.  She left $815,000 with her father’s advisor. It is now worth $650,000.  People are listening to the talking heads on investment shows and the Jim Cramer crowd.  It is so sad.  Yesterday, a talking head on CNBC Power Lunch spent time ranting and raving about how the 60/40 investment model blend is alive and well.  In all my time listening to CNBC and reading over 4 hours a day, I have never heard or read one word about the AGG (The benchmark for bonds) being -15% last year.  Nowhere, no one, is talking or writing about it.  Then again, probably over 90% of licensed advisors don’t know what the AGG is.  

BTW, most of you may have already heard or read about this, but it's important enough to mention again. As a barometer of how bad the financial climate was in 2022, there are only two times in the last 100 years of stock market history when both the S&P-500 AND the AGG were both double digit negative at the same time: 1932 (Great Depression) and 2022! There was no safety in either equities or bond/fixed income portfolios.  Noodle on that!

Read more on pie charts  

Call me, having fun, this is what we do best!!

Jack
240 401 2355

6Lc_psgUAAAAAA9c7MediJBuq3wAxIyxDSt73c9j