The New Tax Law – A Year Later

Tax season is the time between January 1 and April 15. It is when most people prepare and file their taxes.  This year’s tax season is special.  It has been just a little over a year since the Tax Cuts and Jobs Act went into effect. It is the largest overhaul of the tax code since 1986 and the still-relatively-new law could have a major impact on your taxes, including your refund.  Just for that reason, I thought it would be good to review what the law changed, as well as what you can do to minimize headaches as you file your taxes ahead of the April 15 deadline.

Quick disclaimer: The tax law is a politically charged subject, but you will not find any politics here.  While some experts may argue whether the tax law has been good or bad for the country, this letter is only about how the law may affect you. So, without further do, let’s discuss:

Major Changes to Remember as You File

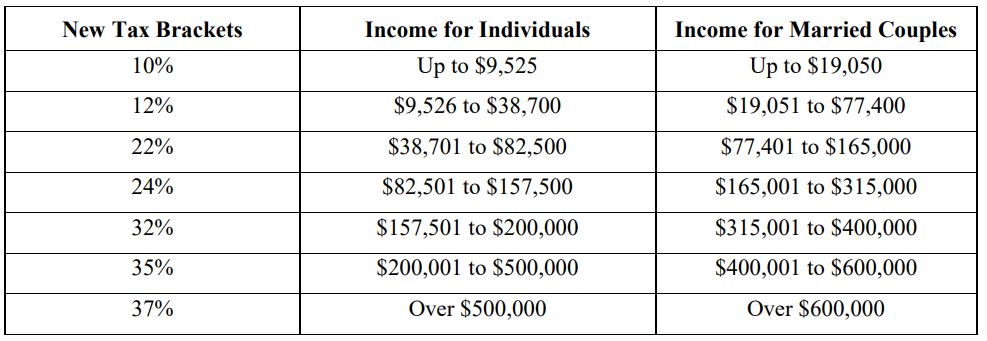
The most obvious major change to remember is that most tax rates have been reduced. That means there’s a good chance you paid less in taxes over the past year. Here’s how the various tax brackets look now: 1

If you receive a paycheck every month, you should pay special attention to your federal income tax withholding this year. This is the amount of federal income tax withheld from your paycheck. Because of the new tax brackets, most people started seeing withholding changes around February or March of last year. And while it’s likely that less of your paycheck went to federal income taxes, you should still scrutinize your withholding carefully to make sure it’s correct. The last thing you want is to find that not enough tax was withheld by your employer! That could require you to pay a penalty when you file your return.

According to the IRS1, people who meet any of the following criteria should be especially careful when checking their withholding:
• Belong to a two-income family.
• Work two more jobs, or only work for part of the year.
• Have children and claim credits such as the Child Tax Credit.
• Have older dependents, including children age 17 or older.
• Claimed itemized deductions on their prior year’s tax returns.
• Earn high incomes and have more complex tax returns.
• Received large tax refunds or had large tax bills for the prior year.

Ensuring the accuracy of your withholding is always important, of course, but because of all the changes to the tax code, it’s more critical than ever that you be thorough!  Speaking of changes, let’s now turn to:

Changes to Deductions

There are two basic kinds of deductions – standard and itemized. As the IRS puts it, “The standard deduction is a dollar amount that reduces the amount of income on which you are taxed and varies according to your filing status.” 1 The new tax law nearly doubled standard deductions. Here’s what the new standard deduction looks like:1

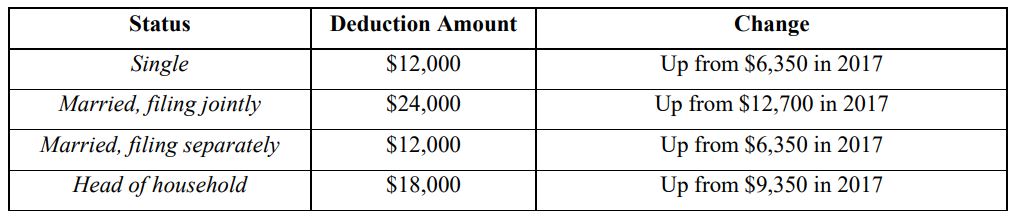
But all this comes with a catch: You can’t take the standard deduction if you also itemize deductions. And for married couples filing separately, both spouses must take the same type of deduction. So if one spouse chooses to itemize, the other spouse must as well. So, here’s what you need to determine: Will you enjoy a larger tax cut by taking the standard deduction, or itemized?

For most people, the standard deduction is probably the way to go. But if you still choose to take itemized deductions, there are changes to those you need to be aware of as well. For instance:

Medical expenses: For your 2018 taxes, you can deduct out-of-pocket medical and dental expenses that exceed 7.5% of your “adjusted gross income”. (This is your total gross income minus specific deductions.) This is down from the previous 10%, although the level returns to normal next year.1
State and local taxes: One of the biggest changes to itemized deductions is that you can now deduct no more than $10,000 of any combination of state and local income taxes, sales taxes, and property taxes. For people living in high-tax states, this is perhaps the single biggest reason why it now makes more sense to take the standard deduction. 1
Mortgage interest: If you took out a mortgage or home equity loan before December 15, 2017, you can deduct up to $1,000,000 in interest. However, the new tax law caps the deduction at $750,000 for loans taken out after that date. 1
Charitable contributions: The limit on charitable contributions in cash is now 60% of your adjusted gross income, up from 50% before the new tax law. That means you may be able to deduct more of any charitable cash contributions you made in 2018. 1

Changes to Child Tax Credits and the AMT
Due to the new law, more families with children under 17 now qualify for a larger child tax credit. For your 2018 return, the maximum credit is now $2,000 per child for individuals earning up to $200,000 and married couples earning up to $400,000, so long as they file jointly. 1

Another major change to this tax season is that fewer people now pay the Alternative Minimum Tax, or AMT. Long considered one of the most complex aspects of the tax code, the AMT was originally designed to prevent using a dizzying array of credits, deductions, and loopholes to avoid taxes altogether. Over the decades, however, the AMT began hitting those who were already paying a host of other taxes.

Calculating what amount people actually pay is a complex process, and that has not changed. What has changed, however, is the threshold at which people are exempt from paying the AMT. For individuals, the exemption level has increased to $70,300, up from $54,300. For married couples who file jointly, the exemption has risen to $109,400, up from $84,500. 1

A few more things to be aware of this tax season
It’s impossible to cover all the ways the new tax law will affect your filing this year. But there are a few more things to be aware of.

Tax Refunds
First, your tax refund could be smaller than in years past. As of this writing, the IRS has reported the average refund to be 8.4% less than last year.2
This shouldn’t come as a surprise. Since many people received a tax cut in 2018, refunds will also go down. That’s especially true for people who previously used itemized deductions on their property and local income taxes. The changes in federal tax withholding also play a major role. It’s possible, too, that many people will end owing money to the government this year.

For that reason, taxpayers should hold off on planning any major purchases until they know exactly what their refund will be.

The IRS is playing catch-up
As you probably know, Washington was paralyzed by the longest government shutdown in history earlier this year. During the shutdown, the IRS operated with only 12% of its staff.3 That means the IRS has a lot to catch up on, including answering questions, preparing reports, processing returns, and distributing refunds. And because the tax code is so different now, you may need to wait longer than normal to get your questions answered or get your refund.

Ways to de-stress your tax filing
Preparing your taxes is never fun, but there are ways to minimize stress. For example:
1. Work with a qualified professional. While there is software aplenty to help you file, nothing beats working with an experienced Certified Public Accountant. I would be happy to put you in touch with a good one if you need assistance with this.
2. File electronically. If you’re doing it on your own, it’s better – and faster – to file electronically than on paper. You can learn more at www.irs.gov/filing/free-file-do-yourfederal-taxes-for-free.
3. Do a “paycheck checkup.” This is a resource the IRS provides to determine if you need to adjust your withholding or make additional tax payments. Visit www.irs.gov/paycheck-checkup to learn more.
4. Start now. If you’ve already finished your tax return, great! But if not, don’t delay. Start gathering documents, writing down questions, and examining your options. The easiest way to ensure tax-related headaches – and make mistakes on your return – is to wait until the last minute.

I hope you found this letter helpful. Of course, if you have any questions, please don’t hesitate to contact us!   Finally, remember that we at Research Financial Strategies are here to help you work toward your financial goals. Please let us know if there’s ever anything we can do.

1 “Tax Reform: Basics for Individuals and Families,” Internal Revenue Service,   https://www.irs.gov/pub/irs-pdf/p5307.pdf%20
2 “Filing Season Statistics for Week Ending February 1, 2019.” Internal Revenue Service,   https://www.irs.gov/newsroom/filing-season-statistics-for-week-ending-february-1-2019
3 “Federal shutdown means tax refunds may be delayed,” CNBC,   https://www.cnbc.com/2019/01/04/what-the-federal-shutdown-could-mean-for-tax-season.html

Market Commentary – February 25, 2019

Investors were pleased with the Federal Reserve’s (Fed) new approach to its balance sheet.
The Fed delivered its semi-annual Monetary Policy Report to Congress last week. The report recapped the events of late 2018 and reiterated the Fed’s intention to “…be patient as it determines what future adjustments to the federal funds rate may be appropriate to support the Committee’s congressionally mandated objectives of maximum employment and price stability.”

In other words, rate hikes are on hold for now.

The Fed also addressed issues related to its balance sheet, which grew from $900 billion at the end of 2006 – about 6 percent of the United States’ gross domestic product (GDP) – to almost $4.5 trillion at the end of 2014 – about 25 percent of U.S. GDP. (GDP is the value of all goods and services produced in the United States in a given period.)

The balance sheet more than quadrupled during the past decade because the Fed began buying Treasuries and mortgage-backed securities, a policy called quantitative easing, in an effort to restore the U.S. economy to health, according to The Hutchins Center of the Brookings Institute.

Friday’s report indicated the Fed will not shrink its balance sheet to pre-crisis levels, reported Erwida Maulia for Financial Times. Markets responded positively to the news:  “U.S. stocks and Treasuries were comfortably higher at midday on Friday as the Federal Reserve signaled it will hold a much larger balance sheet in the long term than it did before the financial crisis, helping ease investor concerns about tightening financial conditions.”

Investors also remained optimistic about trade talks between the United States and China. Major U.S. stock indices finished the week higher.

As levels continue to rise, people and companies around the world are likely to be affected. Morgan Stanley reported, “Many coastal cities around the world that look attractive to real assets investors – for example, Miami, New York, Boston, Osaka, Guangzhou, and Mumbai – are particularly vulnerable to flooding and other weather-related problems. And, infrastructure assets favored by investors, like airports, cell towers, and oil and natural gas pipelines, are often located in places prone to storms and extreme heat…Insurance will continue to be an important safeguard, but a limited one.”

Protecting property and improving infrastructure is likely to change demand for specific goods and services. Sarah Green Carmichael of Barron’s reported, “As we rush to protect basements and beach houses, companies in the home-improvement retail sector should benefit…So should companies that make products to cope with flooding, such as commercial-grade water pumps…Upgrades to infrastructure also mean good news for the construction sector…”

The textile industry – think fabrics and clothing – may also be affected since major exporters like Bangladesh, Indonesia, and the Philippines, which supply 10 percent of the textiles and clothing imported by the United States, are vulnerable to coastal flooding.

Sea level is a macroeconomic issue. It has the potential to affect output and income across the global economy. Investment managers who take a top-down approach to investing consider the ways in which macroeconomic factors, like changing sea levels, could affect the market as a whole, as well as the share prices of specific companies. Bottom-up investors take a different approach. They consider company fundamentals, such as management team and earnings growth potential, first.

Weekly Focus – Think About It
“They always say time changes things, but you actually have to change them yourself.”
–Andy Warhol, American artist

Best regards,
John F. Reutemann, Jr., CLU, CFP®

P.S.  Please feel free to forward this commentary to family, friends, or colleagues. If you would like us to add them to the list, please reply to this email with their email address and we will ask for their permission to be added.

Investment advice offered through Research Financial Strategies, a registered investment advisor.

S&P 500, Dow Jones Global ex-US, Gold, Bloomberg Commodity Index returns exclude reinvested dividends (gold does not pay a dividend) and the three-, five-, and 10-year returns are annualized; the DJ Equity All REIT Total Return Index does include reinvested dividends and the three-, five-, and 10-year returns are annualized; and the 10-year Treasury Note is simply the yield at the close of the day on each of the historical time periods.
Sources: Yahoo! Finance, Barron’s, djindexes.com, London Bullion Market Association.
Past performance is no guarantee of future results. Indices are unmanaged and cannot be invested into directly. N/A means not applicable.

Most Popular Financial Stories

The Fed’s Drive To 2% Inflation

February isn't over yet, but the Cleveland Fed has released its projections for a few key economic markers. Why are these markers important? The Fed likes to look at the Consumer Personal Expenditures (CPE) to gauge whether or not their plan to curb inflation is...

read more

Consumers Expect Better Days Ahead

Many consider the University of Michigan the gold standard for reporting on consumer sentiment and trends. Among its 50 monthly reports, the most well-known is the "UMich Consumer Sentiment" survey, which measures consumer confidence. I also follow the University of...

read more

Wishing You A Happy And Safe Thanksgiving

Thanksgiving is almost here: a time to enjoy friends, family, great food, and maybe a whole lot of football. As we give thanks for what we have received and celebrate the triumphs in our lives, we are continuing a tradition that has lasted for hundreds of years. This...

read more

A.I. Is Everywhere

If you've heard CEOs mention "A.I." multiple times during second-quarter conference calls or on the news, you're not imagining it. There have been an astounding 1,072 mentions of A.I. (and counting) so far.1 Some believe that A.I. (Artificial Intelligence) has the...

read more

Happy Independence Day

The Fourth of July is just ahead – a chance for us all to get together and celebrate what makes America so special. As Americans, we have the liberty to act, speak, think, and worship freely. This precious liberty was fought for, and it has been upheld for more than...

read more

* Government bonds and Treasury Bills are guaranteed by the U.S. government as to the timely payment of principal and interest and, if held to maturity, offer a fixed rate of return and fixed principal value.  However, the value of fund shares is not guaranteed and will fluctuate.
* Corporate bonds are considered higher risk than government bonds but normally offer a higher yield and are subject to market, interest rate and credit risk as well as additional risks based on the quality of issuer coupon rate, price, yield, maturity, and redemption features.
* The Standard & Poor’s 500 (S&P 500) is an unmanaged group of securities considered to be representative of the stock market in general. You cannot invest directly in this index.
* All indexes referenced are unmanaged. Unmanaged index returns do not reflect fees, expenses, or sales charges. Index performance is not indicative of the performance of any investment.
* The Dow Jones Global ex-U.S. Index covers approximately 95% of the market capitalization of the 45 developed and emerging countries included in the Index.
* The 10-year Treasury Note represents debt owed by the United States Treasury to the public. Since the U.S. Government is seen as a risk-free borrower, investors use the 10-year Treasury Note as a benchmark for the long-term bond market.
* Gold represents the afternoon gold price as reported by the London Bullion Market Association. The gold price is set twice daily by the London Gold Fixing Company at 10:30 and 15:00 and is expressed in U.S. dollars per fine troy ounce.
* The Bloomberg Commodity Index is designed to be a highly liquid and diversified benchmark for the commodity futures market. The Index is composed of futures contracts on 19 physical commodities and was launched on July 14, 1998.
* The DJ Equity All REIT Total Return Index measures the total return performance of the equity subcategory of the Real Estate Investment Trust (REIT) industry as calculated by Dow Jones.
* The Dow Jones Industrial Average (DJIA), commonly known as “The Dow,” is an index representing 30 stock of companies maintained and reviewed by the editors of The Wall Street Journal.
* The NASDAQ Composite is an unmanaged index of securities traded on the NASDAQ system.
* International investing involves special risks such as currency fluctuation and political instability and may not be suitable for all investors. These risks are often heightened for investments in emerging markets.
* Yahoo! Finance is the source for any reference to the performance of an index between two specific periods.
* Opinions expressed are subject to change without notice and are not intended as investment advice or to predict future performance.
* Economic forecasts set forth may not develop as predicted and there can be no guarantee that strategies promoted will be successful.
* Past performance does not guarantee future results. Investing involves risk, including loss of principal.
* You cannot invest directly in an index.
* Stock investing involves risk including loss of principal.
* The foregoing information has been obtained from sources considered to be reliable, but we do not guarantee it is accurate or complete.
* There is no guarantee a diversified portfolio will enhance overall returns or outperform a non-diversified portfolio. Diversification does not protect against market risk.
* Asset allocation does not ensure a profit or protect against a loss.
* Consult your financial professional before making any investment decision.
* To unsubscribe from the Weekly Market Commentary please reply to this e-mail with “Unsubscribe” in the subject.

Sources:
https://www.federalreserve.gov/monetarypolicy/2019-02-mpr-summary.htm

https://www.federalreserve.gov/monetarypolicy/2019-02-mpr-part2.htm#xsubsection-1553-1b5b0b6b

https://www.investopedia.com/ask/answers/what-is-gdp-why-its-important-to-economists-investors/

https://www.brookings.edu/blog/up-front/2017/08/18/the-hutchins-center-explains-the-feds-balance-sheet/

https://www.ft.com/content/a80b032e-36c2-11e9-bb0c-42459962a812

https://www.marketwatch.com/story/stock-index-futures-point-higher-on-optimism-over-us-china-trade-talks-2019-02-22

https://science2017.globalchange.gov/chapter/12/ (Key Finding 1 and Key Finding 2)

https://tidesandcurrents.noaa.gov/sltrends/sltrends.html

https://www.morganstanley.com/ideas/real-assets-climate-resilience

https://www.barrons.com/articles/why-sea-level-rise-could-be-good-for-ford-and-home-depot-51550149200

https://www.merriam-webster.com/dictionary/macroeconomics

https://www.investopedia.com/articles/investing/092215/bottomup-and-topdown-investing-explained.asp

https://www.goodreads.com/quotes/tag/change


Advised Brokerage Accounts Are Better Diversified, Reports Schwab

Charles Schwab’s has published its’ latest SDBA Indicators Report, a highly regarded, industry-leading benchmark on retirement plan participant investment activity within approximately 137,000 self-directed brokerage accounts (SDBAs).  The report stated that participants who worked with an advisor had a more diversified asset allocation mix, higher balances, and less exposure to individual stocks compared to non-advised participants.

While only 19 percent of SBDA participants chose to use an advisor, they reported an average balance of $449,552 – nearly twice as much as the $234,643 reported by non-advised participants.  SDBAs are brokerage accounts within retirement plans. These include 401Ks and other types of retirement plans, which participants can use to invest in exchange-traded funds, stocks, bonds, mutual funds and other securities that are not part of their retirement plan’s core investment offerings. 

“The report highlights the benefits of working with an advisor. In general, participants who had professional help were more diversified across all of their holdings. In addition, advisors typically rebalance a portfolio more often and keep their clients invested”
-Schwab

Allocation Trends
In advised accounts, mutual funds continued to hold the highest percentage of participant assets at approximately 50 percent. ETFs were the second-largest allocation, followed by equities, cash and fixed income.

Conversely, non-advised participants allocated nearly 35 percent of their portfolio to individual equities. This was followed by mutual funds, cash, ETFs and fixed income.

When comparing equity holdings, both advised and non-advised participants held Apple, Amazon and Berkshire Hathaway as their top three holdings; however, non-advised participants’ positions in Apple and Amazon were nearly double compared to participants who used an advisor. Additionally, advised participants invested in more blue-chip, value companies, whereas self-directed investors allocated to more growth stocks.

“The report highlights the benefits of working with an advisor. In general, participants who had professional help were more diversified across all of their holdings. In addition, advisors typically rebalance a portfolio more often and keep their clients invested,” said Larry Bohrer, vice president, Corporate Brokerage Retirement Services at Charles Schwab. Generally, payroll contributions into SDBAs are allocated to cash. From there, it is up to the participant or advisor to invest. As the report shows, advisors kept clients’ cash allocations low, while individual investors left more of their SDBA in cash pending investment decisions.

Other Highlights

  • The average SDBA account balance for all participants in the third quarter of 2018 was $265,902, up 3.5 percent from the second quarter of 2018 and up 24 percent from the third quarter of 2017;
  • Advised accounts averaged 9.5 trades in the third quarter compared to 5.5 trades by non-advised participants;
  • Baby Boomers represented the majority of advised accounts (45.4%), followed by Gen X (42.2%) and Millennials (8.5%).

About the SDBA Indicators Report

The SDBA Indicators Report includes data collected from approximately 137,000 retirement plan participants who currently have balances between $5,000 and $10 million in their Schwab Personal Choice Retirement Account. Data is extracted quarterly on all accounts that are open as of quarter-end and meet the balance criteria.

Market Commentary – February 19, 2019

Why did the stock market do that?
The great mystery of stock markets reared its head last week. With no clear driver, the Dow Jones Industrial Average gained more than 3 percent, while the Nasdaq Composite and Standard & Poor’s (S&P) 500 Index moved higher by about 2.5 percent. It was a puzzler. Ben Levisohn of Barron’s explained:  “Given those gains, we’d expect a heaping helping of good news, but not much was forthcoming. Earnings reports from [two large multinational companies] left investors wanting. And economic data were either bad or terrible in the United States – industrial production declined in January, the first drop in eight months, while December’s retail sales fell the most for any month since 2009. But who needs good news when the United States and China are reportedly making progress on trade talks? Yes, the details remain a little fuzzy, but at least the tone is more constructive.”

It probably wasn’t just optimism about China that pushed markets higher. Consumer Sentiment, which gauges Americans expectations for the economy, was up more than 4 percent month-to-month. One driver of consumer optimism was relief the government shutdown had ended. Another driver is a change in inflation expectations, which are at the lowest level seen in half a century. Americans think inflation will remain low and they anticipate wages will rise. The Federal Reserve’s newly accommodative attitude hasn’t hurt, either.

Investor sentiment was leaning bullish last week, too. Willie Delwiche of See It Market reported the Investor Intelligence survey of financial advisors showed 49 percent bullish and 21 percent bearish. The AAII Investor Sentiment Survey reported bulls (40 percent) edged bears (37 percent) by a neck. Those indicators were balanced by the Daily Trading Sentiment Composite from Ned Davis Research which suggested optimism was too high.

When markets rise, as they have during the past few weeks, it may be tempting to take a more aggressive stance and tilt your portfolio toward U.S. stocks. This may not be a good idea.

What’s in your wallet?
You’re at the checkout. How do you pay for your purchase? Do you reach for a credit card, debit card, cash, check, or some form of electronic payment, such as a mobile wallet or wearable?

The Federal Reserve Bank of San Francisco’s 2018 Findings from the Diary of Consumer Payment Choice (DCPC) found participants preferred to pay using debit cards. The order of payment preference was like this:

Financial Advisor, Financial Advisor Bethesda, Financial Advisor Rockville, Financial Advisor Potomac, Financial Advisor Gaithersburg, Financial Advisor Germantown, Financial Advisor Near Me, Investment Advisor, Investment Advisor Bethesda, Investment Advisor Potomac, Investment Advisor Rockville, Investment Advisor Gaithersburg, Retirement Advisor

Here’s an interesting side note. The more money a household earned, the more likely they were to pay by credit card.

Financial Advisor, Financial Advisor Bethesda, Financial Advisor Rockville, Financial Advisor Potomac, Financial Advisor Gaithersburg, Financial Advisor Germantown, Financial Advisor Near Me, Investment Advisor, Investment Advisor Bethesda, Investment Advisor Potomac, Investment Advisor Rockville, Investment Advisor Gaithersburg, Retirement Advisor

The shift in preference begs the question: Do wealthier people have more debt? Some do, but wealthier households are more likely to pay off credit card debt each month, according to author Tom Corley who was cited by Credit.com writer Gerri Detweiler.

If you use credit cards frequently and haven’t been paying down your balance each month, it may be a good idea to do a simple calculation to determine how much you are paying in interest each year. Just multiply the interest rate you pay by the amount of debt you carry. The amount may surprise you. Nerdwallet’s American Household Credit Card Debt Study reported, “Households with revolving credit card debt will pay an average of $1,141 in interest this year.”

If retirement is 10 years in the future, saving $1,141 a year, and earning 6 percent annually on the money, could provide about $16,000 in additional savings. If retirement is 30 years away, you could increase your savings by about $96,000*. It’s food for thought.

*This is a hypothetical example and is not representative of any specific investment. Your results may vary.

Weekly Focus – Think About It
“Wealth consists not in having great possessions, but in having few wants.”
–Epictetus, Greek philosopher

Best regards,

John F. Reutemann, Jr., CLU, CFP®

P.S.  Please feel free to forward this commentary to family, friends, or colleagues. If you would like us to add them to the list, please reply to this email with their email address and we will ask for their permission to be added.

Investment advice offered through Research Financial Strategies, a registered investment advisor.

Financial Advisor, Financial Advisor Bethesda, Financial Advisor Rockville, Financial Advisor Potomac, Financial Advisor Gaithersburg, Financial Advisor Germantown, Financial Advisor Near Me, Investment Advisor, Investment Advisor Bethesda, Investment Advisor Potomac, Investment Advisor Rockville, Investment Advisor Gaithersburg, Retirement Advisor

S&P 500, Dow Jones Global ex-US, Gold, Bloomberg Commodity Index returns exclude reinvested dividends (gold does not pay a dividend) and the three-, five-, and 10-year returns are annualized; the DJ Equity All REIT Total Return Index does include reinvested dividends and the three-, five-, and 10-year returns are annualized; and the 10-year Treasury Note is simply the yield at the close of the day on each of the historical time periods.
Sources: Yahoo! Finance, Barron’s, djindexes.com, London Bullion Market Association.
Past performance is no guarantee of future results. Indices are unmanaged and cannot be invested into directly. N/A means not applicable.

Most Popular Financial Stories

The Fed’s Drive To 2% Inflation

February isn't over yet, but the Cleveland Fed has released its projections for a few key economic markers. Why are these markers important? The Fed likes to look at the Consumer Personal Expenditures (CPE) to gauge whether or not their plan to curb inflation is...

read more

Consumers Expect Better Days Ahead

Many consider the University of Michigan the gold standard for reporting on consumer sentiment and trends. Among its 50 monthly reports, the most well-known is the "UMich Consumer Sentiment" survey, which measures consumer confidence. I also follow the University of...

read more

EVs―The Next Big Thing

EVs―The Next Big ThingAn Interesting EmailWe recently received an interesting email from a reader of our RFS website. Katie Griffin is a Senior Communications Specialist at EcoWatch.org, a group devoted to disseminating information on the environment to help reduce...

read more

Bitcoin – There’s No There There

The Big Guys Move InOn September 13, 2022, the biggest of the big guys on Wall Street came out with a rather earth-shaking announcement. None other than Fidelity, Citadel Securities, and Charles Schwab have launched a new cryptocurrency exchange. In the words of the...

read more

Special Message

Look! Have You Noticed? Listen to any politician or any news commentator these days, and they always begin a discussion or answer a question like this: Look, when I served in the Senate …. Look, as I wrote in my last column …. Look, if the Republicans won’t …. Look,...

read more

* Government bonds and Treasury Bills are guaranteed by the U.S. government as to the timely payment of principal and interest and, if held to maturity, offer a fixed rate of return and fixed principal value.  However, the value of fund shares is not guaranteed and will fluctuate.

* Corporate bonds are considered higher risk than government bonds but normally offer a higher yield and are subject to market, interest rate and credit risk as well as additional risks based on the quality of issuer coupon rate, price, yield, maturity, and redemption features.

* The Standard & Poor’s 500 (S&P 500) is an unmanaged group of securities considered to be representative of the stock market in general. You cannot invest directly in this index.

* All indexes referenced are unmanaged. Unmanaged index returns do not reflect fees, expenses, or sales charges. Index performance is not indicative of the performance of any investment.

* The Dow Jones Global ex-U.S. Index covers approximately 95% of the market capitalization of the 45 developed and emerging countries included in the Index.

* The 10-year Treasury Note represents debt owed by the United States Treasury to the public. Since the U.S. Government is seen as a risk-free borrower, investors use the 10-year Treasury Note as a benchmark for the long-term bond market.

* Gold represents the afternoon gold price as reported by the London Bullion Market Association. The gold price is set twice daily by the London Gold Fixing Company at 10:30 and 15:00 and is expressed in U.S. dollars per fine troy ounce.

* The Bloomberg Commodity Index is designed to be a highly liquid and diversified benchmark for the commodity futures market. The Index is composed of futures contracts on 19 physical commodities and was launched on July 14, 1998.

* The DJ Equity All REIT Total Return Index measures the total return performance of the equity subcategory of the Real Estate Investment Trust (REIT) industry as calculated by Dow Jones.

* The Dow Jones Industrial Average (DJIA), commonly known as “The Dow,” is an index representing 30 stock of companies maintained and reviewed by the editors of The Wall Street Journal.

* The NASDAQ Composite is an unmanaged index of securities traded on the NASDAQ system.

* International investing involves special risks such as currency fluctuation and political instability and may not be suitable for all investors. These risks are often heightened for investments in emerging markets.

* Yahoo! Finance is the source for any reference to the performance of an index between two specific periods.

* Opinions expressed are subject to change without notice and are not intended as investment advice or to predict future performance.

* Economic forecasts set forth may not develop as predicted and there can be no guarantee that strategies promoted will be successful.

* Past performance does not guarantee future results. Investing involves risk, including loss of principal.

* You cannot invest directly in an index.

* Stock investing involves risk including loss of principal.

* The foregoing information has been obtained from sources considered to be reliable, but we do not guarantee it is accurate or complete.

* There is no guarantee a diversified portfolio will enhance overall returns or outperform a non-diversified portfolio. Diversification does not protect against market risk.

* Asset allocation does not ensure a profit or protect against a loss.

* Consult your financial professional before making any investment decision.

* To unsubscribe from the Weekly Market Commentary please reply to this e-mail with “Unsubscribe” in the subject.


Sources:

https://www.barrons.com/articles/dow-rallies-for-eighth-straight-week-amid-china-optimism-51550281278?mod=hp_DAY_1

http://www.sca.isr.umich.edu (or go to http://www.sca.isr.umich.edu/)

https://www.seeitmarket.com/u-s-equities-update-investor-sentiment-full-circle-18971/

https://www.frbsf.org/cash/publications/fed-notes/2018/november/2018-findings-from-the-diary-of-consumer-payment-choice/

https://blog.credit.com/2015/02/5-credit-card-habits-of-the-rich-108720/

https://www.nerdwallet.com/blog/average-credit-card-debt-household/

http://www.moneychimp.com/calculator/compound_interest_calculator.htm

https://www.forbes.com/sites/robertberger/2014/04/30/top-100-money-quotes-of-all-time/#6db006fb4998

Active Portfolio Management – How We Do It!

Active Portfolio Management – How We Do It!

Research Financial Strategies specializes in providing financial advice using a proprietary investment methodology that leverages technical analysis to identify and protect our clients against stock market risk.

Our Approach to Investing

Research Financial Strategies provides our clients with a reproducible, non-emotional investment process using technical analysis to monitor market risk within the industries, sectors, and our actual investment decisions. It starts first with understanding our client’s financial goals & needs and helping them plan for the future. Below is an overview of RFS’s investment process.

Technical analysis is an emotionless investment decision making process that does not allow for getting caught up in the company or industry story. Investments are made through a series of technical factors. The most notable factor is one called “relative strength.” When a security price shows a recognizable pattern of higher highs and higher lows it demonstrates that there is higher demand than supply for that security. This means that the “buyers” are in control and not the “sellers.” While we cannot guarantee investment performance, securities that demonstrate this technical behavior have a higher probably increasing in value.

Determining Investor Suitability

As investment advisors it is our fiduciary responsibility to make sure we understand each of our client’s investment tolerance and risk profile. Research Financial Strategies has the unique capability to create unlimited customized asset allocation blends for our diverse client base. 

Determining When to Invest

The oldest law of economics is supply and demand. At Research Financial Strategies, we place a premium on when to make an investment decision based on price movements using technical analysis. Technical analysis is an emotionless investment decision making process that does not allow for getting caught up in the company or industry story. Investments are made through a series of technical factors. The most notable factor is one called relative strength. When a security price shows a recognizable pattern of higher highs and higher lows it demonstrates that there is higher demand than supply for that security. This means that the buyers are in control and not the sellers.

Determining When to Exit an Investment

Our ability to minimize portfolio risk for our client is a result of having a Sell-Side Discipline. Prior to investing in a security we establish an exit point based on the % of loss or price our investment advisors determine is acceptable. If the security price is violated then it is sold. This ensures that profits are protected for our clients, or worst case, risk to principle is minimized. Only through having an investment approach that has a pre-determined exit strategy for each investment position, can you mitigate portfolio risk during market corrections.

Most Popular Financial Stories

The Fed’s Drive To 2% Inflation

February isn't over yet, but the Cleveland Fed has released its projections for a few key economic markers. Why are these markers important? The Fed likes to look at the Consumer Personal Expenditures (CPE) to gauge whether or not their plan to curb inflation is...

read more

Consumers Expect Better Days Ahead

Many consider the University of Michigan the gold standard for reporting on consumer sentiment and trends. Among its 50 monthly reports, the most well-known is the "UMich Consumer Sentiment" survey, which measures consumer confidence. I also follow the University of...

read more

Wishing You A Happy And Safe Thanksgiving

Thanksgiving is almost here: a time to enjoy friends, family, great food, and maybe a whole lot of football. As we give thanks for what we have received and celebrate the triumphs in our lives, we are continuing a tradition that has lasted for hundreds of years. This...

read more

A.I. Is Everywhere

If you've heard CEOs mention "A.I." multiple times during second-quarter conference calls or on the news, you're not imagining it. There have been an astounding 1,072 mentions of A.I. (and counting) so far.1 Some believe that A.I. (Artificial Intelligence) has the...

read more

Happy Independence Day

The Fourth of July is just ahead – a chance for us all to get together and celebrate what makes America so special. As Americans, we have the liberty to act, speak, think, and worship freely. This precious liberty was fought for, and it has been upheld for more than...

read more
6Lc_psgUAAAAAA9c7MediJBuq3wAxIyxDSt73c9j