No Results Found
The page you requested could not be found. Try refining your search, or use the navigation above to locate the post.
A common mistake people make is to give up what they want most for what they only want right now. Pick which goals in your life are most important to you, and make achieving those goals your utmost priority. Then…
People commonly prioritize the short-term over the long-term. But a great way to determine if the decision is a good one is to ask yourself if you are mortgaging your future to pay for your present.


Financial Decisions rarely need to be made in a hurry. In fact, fast decisions tend to be poor decisions! Get all the facts and learn your option, so that your decision is at least an informed one.
Volaire once said, “perfect is the enemy of the good.” When making a financial decision, don'[t stress so much over whether your decision is perfect that you end up paralyzing yourself and missing out on opportunities. A lot of small, good decisions tend to weigh more than one perfect decision.
The most important thing you can do to make good financial decisions is to ask questions first. Talk to qualified experts. Chat with people who’ve been in the same situation as you. As the saying goes, “He who asks a question is confused for a minute. He who does not is confused forever.”

We are here to help you design a financial strategy that is molded specifically for you. One that changes as your life changes. Financial investments to help you live worry-free now and in the future.
Is it a soft landing?
Economists use aviation metaphors to describe the results of central banks’ efforts to manage rapidly growing economies. If the Federal Reserve lifts rates enough to prevent the economy from overheating without jolting it into recession, then it has engineered a soft landing, according to Investopedia. (Rate increases that drop a country into recession are hard landings.)
Ben Levisohn of Barron’s thinks recent Fed actions may have produced the second soft landing in the history of the United States:
“…the Federal Reserve might have engineered a soft landing for the U.S. economy…When Chairman Jerome Powell abruptly decided that he would hold off on further rate hikes, the market responded as if a recession was no longer in the offing. And it probably isn’t…There are also signs that the Fed, simply by taking a breather, has eased monetary conditions. The evidence: The yield curve is steepening. The difference between 30-year and two-year Treasury yields – the spread most correlated to money supply – has risen to about 0.6 percentage point, the highest since June…”
Not everyone agrees. Last week, Economist Robert Shiller told Bloomberg, “The economy has been growing pretty smoothly…There are some signs there might be things amiss. The housing market is soaring and the stock market is high. It’s been a long time that we’ve been in this recovery period and it wouldn’t surprise me at all if there was a recession.”
The Standard & Poor’s 500 Index and Nasdaq Composite delivered slight gains last week, while the Dow Jones Industrial Average was flat.
here’s a blast from the past. Depending on your age, the 1980s may be a nostalgic chapter in your life or the wellspring of amusing photos of your Miami-Vice clad, lace-gloved parents. The 80s are known for more than MTV, yuppies, sci-fi movies, and cell phones the size of shoeboxes, though. The decade marked the start of a new era in geopolitics as the Cold War ended and the Berlin Wall was dismantled.
The 1980s also brought a wealth of innovative new products that disrupted markets and changed the way people perform everyday tasks. Entrepreneur Magazine recently identified some of the decade’s notable inventions, including:
While the fashions have become obsolete, along with camcorders and CD players, many of the decade’s inventions have proven more durable – and some have completely changed the way people interact with the world.
Which of this decade’s inventions do you think could have a similar impact?
Weekly Focus – Think About It
“Don’t let anyone rob you of your imagination, your creativity, or your curiosity. It’s your place in the world; it’s your life. Go on and do all you can with it, and make it the life you want to live.”
–-Mae Jemison, American engineer, physician, and NASA astronaut
Best regards,
John F. Reutemann, Jr., CLU, CFP®
P.S. Please feel free to forward this commentary to family, friends, or colleagues. If you would like us to add them to the list, please reply to this email with their email address and we will ask for their permission to be added.
Investment advice offered through Research Financial Strategies, a registered investment advisor.
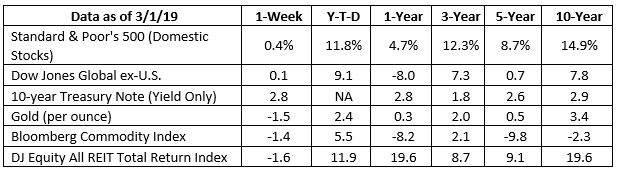
S&P 500, Dow Jones Global ex-US, Gold, Bloomberg Commodity Index returns exclude reinvested dividends (gold does not pay a dividend) and the three-, five-, and 10-year returns are annualized; the DJ Equity All REIT Total Return Index does include reinvested dividends and the three-, five-, and 10-year returns are annualized; and the 10-year Treasury Note is simply the yield at the close of the day on each of the historical time periods.
Sources: Yahoo! Finance, Barron’s, djindexes.com, London Bullion Market Association.
Past performance is no guarantee of future results. Indices are unmanaged and cannot be invested into directly. N/A means not applicable.
The page you requested could not be found. Try refining your search, or use the navigation above to locate the post.
* Government bonds and Treasury Bills are guaranteed by the U.S. government as to the timely payment of principal and interest and, if held to maturity, offer a fixed rate of return and fixed principal value. However, the value of fund shares is not guaranteed and will fluctuate.
* Corporate bonds are considered higher risk than government bonds but normally offer a higher yield and are subject to market, interest rate and credit risk as well as additional risks based on the quality of issuer coupon rate, price, yield, maturity, and redemption features.
* The Standard & Poor’s 500 (S&P 500) is an unmanaged group of securities considered to be representative of the stock market in general. You cannot invest directly in this index.
* All indexes referenced are unmanaged. Unmanaged index returns do not reflect fees, expenses, or sales charges. Index performance is not indicative of the performance of any investment.
* The Dow Jones Global ex-U.S. Index covers approximately 95% of the market capitalization of the 45 developed and emerging countries included in the Index.
* The 10-year Treasury Note represents debt owed by the United States Treasury to the public. Since the U.S. Government is seen as a risk-free borrower, investors use the 10-year Treasury Note as a benchmark for the long-term bond market.
* Gold represents the afternoon gold price as reported by the London Bullion Market Association. The gold price is set twice daily by the London Gold Fixing Company at 10:30 and 15:00 and is expressed in U.S. dollars per fine troy ounce.
* The Bloomberg Commodity Index is designed to be a highly liquid and diversified benchmark for the commodity futures market. The Index is composed of futures contracts on 19 physical commodities and was launched on July 14, 1998.
* The DJ Equity All REIT Total Return Index measures the total return performance of the equity subcategory of the Real Estate Investment Trust (REIT) industry as calculated by Dow Jones.
* The Dow Jones Industrial Average (DJIA), commonly known as “The Dow,” is an index representing 30 stock of companies maintained and reviewed by the editors of The Wall Street Journal.
* The NASDAQ Composite is an unmanaged index of securities traded on the NASDAQ system.
* International investing involves special risks such as currency fluctuation and political instability and may not be suitable for all investors. These risks are often heightened for investments in emerging markets.
* Yahoo! Finance is the source for any reference to the performance of an index between two specific periods.
* Opinions expressed are subject to change without notice and are not intended as investment advice or to predict future performance.
* Economic forecasts set forth may not develop as predicted and there can be no guarantee that strategies promoted will be successful.
* Past performance does not guarantee future results. Investing involves risk, including loss of principal.
* You cannot invest directly in an index.
* Stock investing involves risk including loss of principal.
* The foregoing information has been obtained from sources considered to be reliable, but we do not guarantee it is accurate or complete.
* There is no guarantee a diversified portfolio will enhance overall returns or outperform a non-diversified portfolio. Diversification does not protect against market risk.
* Asset allocation does not ensure a profit or protect against a loss.
* Consult your financial professional before making any investment decision.
* To unsubscribe from the Weekly Market Commentary please reply to this e-mail with “Unsubscribe” in the subject.
Sources:
https://www.investopedia.com/terms/s/softlanding.asp
https://www.investopedia.com/terms/h/hardlanding.asp
https://www.barrons.com/articles/the-dow-just-had-its-best-two-months-in-years-and-there-could-be-more-to-come-51551493199?refsec=the-trader
https://www.bloomberg.com/news/videos/2019-02-26/yale-s-shiller-says-u-s-due-for-recession-sees-housing-market-slowing-video (Time stamp 0:21 seconds)
https://money.cnn.com/data/markets/sandp/
https://money.cnn.com/data/markets/nasdaq/
https://money.cnn.com/data/markets/dow/
https://www.history.com/topics/1980s/1980s
https://www.retrowaste.com/1980s/
https://www.thoughtco.com/michael-jackson-videos-3245489
https://www.entrepreneur.com/slideshow/294171#2
https://www.entrepreneur.com/slideshow/294171#3
http://time.com/3971914/cd-history-music/
https://www.entrepreneur.com/slideshow/294171#5
https://www.entrepreneur.com/slideshow/294171#6
https://www.entrepreneur.com/slideshow/294171#7
https://www.computerhistory.org/timeline/ (See 1980, 1981, and 1984)
https://interestingengineering.com/25-quotes-from-powerful-women-in-stem-who-will-inspire-you
Charles Schwab’s has published its’ latest SDBA Indicators Report, a highly regarded, industry-leading benchmark on retirement plan participant investment activity within approximately 137,000 self-directed brokerage accounts (SDBAs). The report stated that participants who worked with an advisor had a more diversified asset allocation mix, higher balances, and less exposure to individual stocks compared to non-advised participants.
While only 19 percent of SBDA participants chose to use an advisor, they reported an average balance of $449,552 – nearly twice as much as the $234,643 reported by non-advised participants. SDBAs are brokerage accounts within retirement plans. These include 401Ks and other types of retirement plans, which participants can use to invest in exchange-traded funds, stocks, bonds, mutual funds and other securities that are not part of their retirement plan’s core investment offerings.
“The report highlights the benefits of working with an advisor. In general, participants who had professional help were more diversified across all of their holdings. In addition, advisors typically rebalance a portfolio more often and keep their clients invested”
-Schwab
Allocation Trends
In advised accounts, mutual funds continued to hold the highest percentage of participant assets at approximately 50 percent. ETFs were the second-largest allocation, followed by equities, cash and fixed income.
Conversely, non-advised participants allocated nearly 35 percent of their portfolio to individual equities. This was followed by mutual funds, cash, ETFs and fixed income.
When comparing equity holdings, both advised and non-advised participants held Apple, Amazon and Berkshire Hathaway as their top three holdings; however, non-advised participants’ positions in Apple and Amazon were nearly double compared to participants who used an advisor. Additionally, advised participants invested in more blue-chip, value companies, whereas self-directed investors allocated to more growth stocks.
“The report highlights the benefits of working with an advisor. In general, participants who had professional help were more diversified across all of their holdings. In addition, advisors typically rebalance a portfolio more often and keep their clients invested,” said Larry Bohrer, vice president, Corporate Brokerage Retirement Services at Charles Schwab. Generally, payroll contributions into SDBAs are allocated to cash. From there, it is up to the participant or advisor to invest. As the report shows, advisors kept clients’ cash allocations low, while individual investors left more of their SDBA in cash pending investment decisions.
Other Highlights
About the SDBA Indicators Report
The SDBA Indicators Report includes data collected from approximately 137,000 retirement plan participants who currently have balances between $5,000 and $10 million in their Schwab Personal Choice Retirement Account. Data is extracted quarterly on all accounts that are open as of quarter-end and meet the balance criteria.
Why did the stock market do that?
The great mystery of stock markets reared its head last week. With no clear driver, the Dow Jones Industrial Average gained more than 3 percent, while the Nasdaq Composite and Standard & Poor’s (S&P) 500 Index moved higher by about 2.5 percent. It was a puzzler. Ben Levisohn of Barron’s explained: “Given those gains, we’d expect a heaping helping of good news, but not much was forthcoming. Earnings reports from [two large multinational companies] left investors wanting. And economic data were either bad or terrible in the United States – industrial production declined in January, the first drop in eight months, while December’s retail sales fell the most for any month since 2009. But who needs good news when the United States and China are reportedly making progress on trade talks? Yes, the details remain a little fuzzy, but at least the tone is more constructive.”
It probably wasn’t just optimism about China that pushed markets higher. Consumer Sentiment, which gauges Americans expectations for the economy, was up more than 4 percent month-to-month. One driver of consumer optimism was relief the government shutdown had ended. Another driver is a change in inflation expectations, which are at the lowest level seen in half a century. Americans think inflation will remain low and they anticipate wages will rise. The Federal Reserve’s newly accommodative attitude hasn’t hurt, either.
Investor sentiment was leaning bullish last week, too. Willie Delwiche of See It Market reported the Investor Intelligence survey of financial advisors showed 49 percent bullish and 21 percent bearish. The AAII Investor Sentiment Survey reported bulls (40 percent) edged bears (37 percent) by a neck. Those indicators were balanced by the Daily Trading Sentiment Composite from Ned Davis Research which suggested optimism was too high.
When markets rise, as they have during the past few weeks, it may be tempting to take a more aggressive stance and tilt your portfolio toward U.S. stocks. This may not be a good idea.
What’s in your wallet?
You’re at the checkout. How do you pay for your purchase? Do you reach for a credit card, debit card, cash, check, or some form of electronic payment, such as a mobile wallet or wearable?
The Federal Reserve Bank of San Francisco’s 2018 Findings from the Diary of Consumer Payment Choice (DCPC) found participants preferred to pay using debit cards. The order of payment preference was like this:

Here’s an interesting side note. The more money a household earned, the more likely they were to pay by credit card.

The shift in preference begs the question: Do wealthier people have more debt? Some do, but wealthier households are more likely to pay off credit card debt each month, according to author Tom Corley who was cited by Credit.com writer Gerri Detweiler.
If you use credit cards frequently and haven’t been paying down your balance each month, it may be a good idea to do a simple calculation to determine how much you are paying in interest each year. Just multiply the interest rate you pay by the amount of debt you carry. The amount may surprise you. Nerdwallet’s American Household Credit Card Debt Study reported, “Households with revolving credit card debt will pay an average of $1,141 in interest this year.”
If retirement is 10 years in the future, saving $1,141 a year, and earning 6 percent annually on the money, could provide about $16,000 in additional savings. If retirement is 30 years away, you could increase your savings by about $96,000*. It’s food for thought.
*This is a hypothetical example and is not representative of any specific investment. Your results may vary.
Weekly Focus – Think About It
“Wealth consists not in having great possessions, but in having few wants.”
–Epictetus, Greek philosopher
Best regards,
John F. Reutemann, Jr., CLU, CFP®
P.S. Please feel free to forward this commentary to family, friends, or colleagues. If you would like us to add them to the list, please reply to this email with their email address and we will ask for their permission to be added.
Investment advice offered through Research Financial Strategies, a registered investment advisor.

S&P 500, Dow Jones Global ex-US, Gold, Bloomberg Commodity Index returns exclude reinvested dividends (gold does not pay a dividend) and the three-, five-, and 10-year returns are annualized; the DJ Equity All REIT Total Return Index does include reinvested dividends and the three-, five-, and 10-year returns are annualized; and the 10-year Treasury Note is simply the yield at the close of the day on each of the historical time periods.
Sources: Yahoo! Finance, Barron’s, djindexes.com, London Bullion Market Association.
Past performance is no guarantee of future results. Indices are unmanaged and cannot be invested into directly. N/A means not applicable.
The page you requested could not be found. Try refining your search, or use the navigation above to locate the post.
* Government bonds and Treasury Bills are guaranteed by the U.S. government as to the timely payment of principal and interest and, if held to maturity, offer a fixed rate of return and fixed principal value. However, the value of fund shares is not guaranteed and will fluctuate.
* Corporate bonds are considered higher risk than government bonds but normally offer a higher yield and are subject to market, interest rate and credit risk as well as additional risks based on the quality of issuer coupon rate, price, yield, maturity, and redemption features.
* The Standard & Poor’s 500 (S&P 500) is an unmanaged group of securities considered to be representative of the stock market in general. You cannot invest directly in this index.
* All indexes referenced are unmanaged. Unmanaged index returns do not reflect fees, expenses, or sales charges. Index performance is not indicative of the performance of any investment.
* The Dow Jones Global ex-U.S. Index covers approximately 95% of the market capitalization of the 45 developed and emerging countries included in the Index.
* The 10-year Treasury Note represents debt owed by the United States Treasury to the public. Since the U.S. Government is seen as a risk-free borrower, investors use the 10-year Treasury Note as a benchmark for the long-term bond market.
* Gold represents the afternoon gold price as reported by the London Bullion Market Association. The gold price is set twice daily by the London Gold Fixing Company at 10:30 and 15:00 and is expressed in U.S. dollars per fine troy ounce.
* The Bloomberg Commodity Index is designed to be a highly liquid and diversified benchmark for the commodity futures market. The Index is composed of futures contracts on 19 physical commodities and was launched on July 14, 1998.
* The DJ Equity All REIT Total Return Index measures the total return performance of the equity subcategory of the Real Estate Investment Trust (REIT) industry as calculated by Dow Jones.
* The Dow Jones Industrial Average (DJIA), commonly known as “The Dow,” is an index representing 30 stock of companies maintained and reviewed by the editors of The Wall Street Journal.
* The NASDAQ Composite is an unmanaged index of securities traded on the NASDAQ system.
* International investing involves special risks such as currency fluctuation and political instability and may not be suitable for all investors. These risks are often heightened for investments in emerging markets.
* Yahoo! Finance is the source for any reference to the performance of an index between two specific periods.
* Opinions expressed are subject to change without notice and are not intended as investment advice or to predict future performance.
* Economic forecasts set forth may not develop as predicted and there can be no guarantee that strategies promoted will be successful.
* Past performance does not guarantee future results. Investing involves risk, including loss of principal.
* You cannot invest directly in an index.
* Stock investing involves risk including loss of principal.
* The foregoing information has been obtained from sources considered to be reliable, but we do not guarantee it is accurate or complete.
* There is no guarantee a diversified portfolio will enhance overall returns or outperform a non-diversified portfolio. Diversification does not protect against market risk.
* Asset allocation does not ensure a profit or protect against a loss.
* Consult your financial professional before making any investment decision.
* To unsubscribe from the Weekly Market Commentary please reply to this e-mail with “Unsubscribe” in the subject.
Sources:
http://www.sca.isr.umich.edu (or go to http://www.sca.isr.umich.edu/)
https://www.seeitmarket.com/u-s-equities-update-investor-sentiment-full-circle-18971/
https://blog.credit.com/2015/02/5-credit-card-habits-of-the-rich-108720/
https://www.nerdwallet.com/blog/average-credit-card-debt-household/
http://www.moneychimp.com/calculator/compound_interest_calculator.htm
https://www.forbes.com/sites/robertberger/2014/04/30/top-100-money-quotes-of-all-time/#6db006fb4998

Research Financial Strategies specializes in providing financial advice using a proprietary investment methodology that leverages technical analysis to identify and protect our clients against stock market risk.
Research Financial Strategies provides our clients with a reproducible, non-emotional investment process using technical analysis to monitor market risk within the industries, sectors, and our actual investment decisions. It starts first with understanding our client’s financial goals & needs and helping them plan for the future. Below is an overview of RFS’s investment process.
Technical analysis is an emotionless investment decision making process that does not allow for getting caught up in the company or industry story. Investments are made through a series of technical factors. The most notable factor is one called “relative strength.” When a security price shows a recognizable pattern of higher highs and higher lows it demonstrates that there is higher demand than supply for that security. This means that the “buyers” are in control and not the “sellers.” While we cannot guarantee investment performance, securities that demonstrate this technical behavior have a higher probably increasing in value.
As investment advisors it is our fiduciary responsibility to make sure we understand each of our client’s investment tolerance and risk profile. Research Financial Strategies has the unique capability to create unlimited customized asset allocation blends for our diverse client base.
The oldest law of economics is supply and demand. At Research Financial Strategies, we place a premium on when to make an investment decision based on price movements using technical analysis. Technical analysis is an emotionless investment decision making process that does not allow for getting caught up in the company or industry story. Investments are made through a series of technical factors. The most notable factor is one called relative strength. When a security price shows a recognizable pattern of higher highs and higher lows it demonstrates that there is higher demand than supply for that security. This means that the buyers are in control and not the sellers.
Our ability to minimize portfolio risk for our client is a result of having a Sell-Side Discipline. Prior to investing in a security we establish an exit point based on the % of loss or price our investment advisors determine is acceptable. If the security price is violated then it is sold. This ensures that profits are protected for our clients, or worst case, risk to principle is minimized. Only through having an investment approach that has a pre-determined exit strategy for each investment position, can you mitigate portfolio risk during market corrections.
Yesterday the RFS investment committee made the tough decision to sell your “short” positions, SQQQ and SPXS. So far it is working. You're probably wondering what has changed and why? The S&P 500 index, our main benchmark, has put up 6 green bars out of 9 in...
The Big Guys Move InOn September 13, 2022, the biggest of the big guys on Wall Street came out with a rather earth-shaking announcement. None other than Fidelity, Citadel Securities, and Charles Schwab have launched a new cryptocurrency exchange. In the words of the...
The market’s having a trying month. Fortunately, we are attuned to the economic reports that are coming out daily and will safeguard your portfolios by adjusting to the news.Jerome Powell, Chairman of the Federal Reserve, repeatedly has confirmed the...
It Was the Best of Times ….On Friday the 26th, we locked in a big win.Nine days earlier, on Wednesday the 17th, as a protective shield, we purchased a large position in SQQQ, a triple short. We sold that position on Friday, earning an 11% profit on a 40%...
Tough TimesWhen times get rough, the natural human urge becomes one of extreme frugality. Certainly those who survived the Great Depression developed various habits prompting others to view them as “penny pinchers.”Well, today, those sitting...
Look! Have You Noticed? Listen to any politician or any news commentator these days, and they always begin a discussion or answer a question like this: Look, when I served in the Senate …. Look, as I wrote in my last column …. Look, if the Republicans won’t …. Look,...