Market – Commentary January 7, 2019
Investors will think of the last quarter of 2018 for years to come, but they won’t remember it fondly.
The Economist described it like this, “After a rotten October and limp November, the S&P 500 tumbled in value by 15 percent between November 30th and December 24th. Despite an astonishing bounce of 5 percent the day after Christmas, the index finished the year 6 percent below where it started…”
Last quarter’s volatility and the slide in share prices owed much to uncertainty about economic growth. Investors were concerned about a variety of issues, including:
- The Federal Reserve making a mistake. Many in financial markets worried the Fed would raise rates too high, too quickly and stifle economic growth. Last week, the Fed put those fears to rest when its Chair, Jerome Powell, suggested the Fed was willing to stop increasing rates during 2019 if there were signs of economic weakness. Investors rejoiced and the three major U.S. indices experienced significant gains on Friday.
- Weaker corporate profits. Companies were remarkably profitable during the first three quarters of 2018, in part because of the boost from tax reform. However, there were worries fourth quarter earnings would be weaker as the effects of the stimulus faded. Last week, John Butters of FactSet reported, after three quarters of 25 percent or higher earnings growth, the estimated earnings growth rate for fourth quarter 2018 is 11.4 percent.
- A slowdown in global economic growth. Trade wars and tariffs clouded the outlook for global growth throughout the year. The Economist reported there were signs of economic slowdown in China, and one American technology firm attributed a sharp downturn in its profitability to weaker economic growth in China. There were also signs of economic weakness in Europe.
- A slowdown in domestic economic growth. Investors have been worried that trade issues, the government shutdown, and other matters could negatively affect economic growth at home. If the government shutdown is resolved quickly, these worries may prove overblown. Last week, Taylor Telford of the Washington Post reported, “…According to interviews with several analysts: The economy is fundamentally strong, and the stock market has overreacted to concerns about a modest slowing.”
As anxiety rose during the fourth quarter of 2018, some investors rushed to the perceived safety of bonds. High demand pushed the yield on 10-year Treasury bonds lower. It dropped from 2.99 percent to 2.69 percent during December, according to Yahoo! Finance.
While increasing bond exposure may have been a prudent portfolio adjustment for investors who were taking more risk than they could bear, those who moved out of stocks on fear missed out. The Standard & Poor’s 500 Index and the Dow Jones Industrial Average posted their biggest one-day point gains on record on December 26, reported Emily McCormick for Yahoo! Finance.
At this point, some investors feel overwhelmed and worried about their ability to reach personal financial goals. If you’re one of them, please give us a call. Sometimes, reviewing life and financial goals, and the reasoning behind portfolio choices, may be reassuring. We look forward to hearing from you.
What is midwest nice?
The Economist recently explored whether there was a basis for the idea that Americans who live in mid-western states are more congenial than people from other states. The publication explained ‘Midwest nice’ this way, “It is apologizing involuntarily when scooting past someone, both to warn of your presence and to express regret for any inconvenience your mere existence may have caused. It is greeting people as they step into a lift and wishing them well as they leave. It is a strong preference for avoiding confrontation.”
The Economist found it all depends on how you measure ‘nice.’
If the standard is volunteerism, the Corporation for National and Community Service reported three of the five states where people volunteer the most are in the Midwest:
1) Utah (West)
2) Minnesota (Midwest)
3) Wisconsin (Midwest)
4) South Dakota (Midwest)
5) Idaho (West)
If the standard is personality, the Midwest shares the blue ribbon for friendliness. A group of researchers from the United States, Britain, and Finland mapped the psychological topography of the United States and found people in Middle America and the South to be friendly and conventional, while those on the West Coast, in Rocky Mountains, and along the Sunbelt were relaxed and creative. Americans in the Mid-Atlantic and Northeast regions were temperamental and uninhibited.
When it comes to charitable giving, Utah and the Southern states come out on top. Southerners give the highest percentage of earnings to charities. The money primarily goes to churches.
The preponderance of the data considered by The Economist suggest that ‘Midwest nice’ has a basis in reality.
Weekly Focus – Think About It
“The wind comes across the plains not howling but singing. It’s the difference between this wind and its big-city cousins: the full-throated wind of the plains has leeway to seek out the hidden registers of its voice. Where immigrant farmers planted windbreaks a hundred and fifty years ago, it keens in protest; where the young corn shoots up, it whispers as it passes, crossing field after field in its own time, following eastward trends but in no hurry to find open water. You can’t usually see it in paintings, but it’s an important part of the scenery.”
– John Darnielle, Musician and author
Best regards,
John F. Reutemann, Jr., CLU, CFP®
P.S. Please feel free to forward this commentary to family, friends, or colleagues. If you would like us to add them to the list, please reply to this email with their email address and we will ask for their permission to be added.
Investment advice offered through Research Financial Strategies, a registered investment advisor.
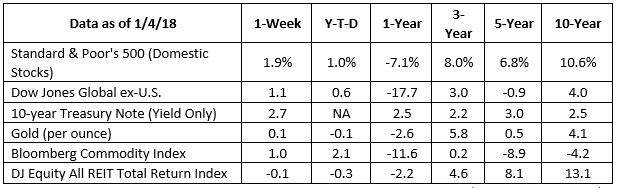
S&P 500, Dow Jones Global ex-US, Gold, Bloomberg Commodity Index returns exclude reinvested dividends (gold does not pay a dividend) and the three-, five-, and 10-year returns are annualized; the DJ Equity All REIT Total Return Index does include reinvested dividends and the three-, five-, and 10-year returns are annualized; and the 10-year Treasury Note is simply the yield at the close of the day on each of the historical time periods.
Sources: Yahoo! Finance, Barron’s, djindexes.com, London Bullion Market Association.
Past performance is no guarantee of future results. Indices are unmanaged and cannot be invested into directly. N/A means not applicable.
* Government bonds and Treasury Bills are guaranteed by the U.S. government as to the timely payment of principal and interest and, if held to maturity, offer a fixed rate of return and fixed principal value. However, the value of fund shares is not guaranteed and will fluctuate.
* Corporate bonds are considered higher risk than government bonds but normally offer a higher yield and are subject to market, interest rate and credit risk as well as additional risks based on the quality of issuer coupon rate, price, yield, maturity, and redemption features.
* The Standard & Poor’s 500 (S&P 500) is an unmanaged group of securities considered to be representative of the stock market in general. You cannot invest directly in this index.
* All indexes referenced are unmanaged. Unmanaged index returns do not reflect fees, expenses, or sales charges. Index performance is not indicative of the performance of any investment.
* The Dow Jones Global ex-U.S. Index covers approximately 95 percent of the market capitalization of the 45 developed and emerging countries included in the Index.
* The 10-year Treasury Note represents debt owed by the United States Treasury to the public. Since the U.S. Government is seen as a risk-free borrower, investors use the 10-year Treasury Note as a benchmark for the long-term bond market.
* Gold represents the afternoon gold price as reported by the London Bullion Market Association. The gold price is set twice daily by the London Gold Fixing Company at 10:30 and 15:00 and is expressed in U.S. dollars per fine troy ounce.
* The Bloomberg Commodity Index is designed to be a highly liquid and diversified benchmark for the commodity futures market. The Index is composed of futures contracts on 19 physical commodities and was launched on July 14, 1998.
* The DJ Equity All REIT Total Return Index measures the total return performance of the equity subcategory of the Real Estate Investment Trust (REIT) industry as calculated by Dow Jones.
* The Dow Jones Industrial Average (DJIA), commonly known as “The Dow,” is an index representing 30 stock of companies maintained and reviewed by the editors of The Wall Street Journal.
* The NASDAQ Composite is an unmanaged index of securities traded on the NASDAQ system.
* International investing involves special risks such as currency fluctuation and political instability and may not be suitable for all investors. These risks are often heightened for investments in emerging markets.
* Yahoo! Finance is the source for any reference to the performance of an index between two specific periods.
* Opinions expressed are subject to change without notice and are not intended as investment advice or to predict future performance.
* Economic forecasts set forth may not develop as predicted and there can be no guarantee that strategies promoted will be successful.
* Past performance does not guarantee future results. Investing involves risk, including loss of principal.
* You cannot invest directly in an index.
* Stock investing involves risk including loss of principal.
* The foregoing information has been obtained from sources considered to be reliable, but we do not guarantee it is accurate or complete.
* Consult your financial professional before making any investment decision.
* To unsubscribe from the Weekly Market Commentary please reply to this e-mail with “Unsubscribe” in the subject.
Sources:
https://www.economist.com/finance-and-economics/2019/01/05/what-the-market-turmoil-means-for-2019
https://www.bloomberg.com/news/articles/2019-01-04/powell-says-fed-ready-to-adjust-policy-if-needed-can-be-patient
https://www.cnn.com/2019/01/04/investing/dow-stock-market-today/index.html
https://www.nytimes.com/2018/12/27/us/politics/trump-tax-cuts-jobs-act.html
https://insight.factset.com/sp-500-2018-earnings-preview-highest-earnings-growth-in-eight-years
https://insight.factset.com/largest-cuts-to-quarterly-sp-500-eps-estimates-since-q3-2017 (download report)
https://www.cnbc.com/2019/01/04/stock-market-comeback-is-now-in-the-hands-of-china-us-trade-talks.html
https://www.washingtonpost.com/business/2019/01/04/stock-market-has-been-going-down-down-down-so-why-do-so-many-analysts-think-itll-go-way-up-this-year/?noredirect=on&utm_term=.59bd81bd0720
https://finance.yahoo.com/quote/%5ETNX/history?p=%5ETNX
https://finance.yahoo.com/news/stock-futures-rise-christmas-eve-sell-off-134312777.html
https://richardlangworth.com/success
https://www.economist.com/graphic-detail/2018/12/27/is-there-any-truth-to-the-idea-of-midwestern-nice
https://www.nationalservice.gov/vcla/state-rankings-volunteer-rate
https://www.apa.org/pubs/journals/releases/psp-a0034434.pdf
https://www.goodreads.com/quotes/tag/midwest