Market Commentary – September 24, 2018
Did you hear the news?
A tech company introduced a microwave you can turn on using Wi-Fi – as long as you have one of the company’s voice assistants at home, reported Kaitlyn Tiffany of Vox. Soon, the voice assistants will be built with neural networks that will formulate hunches about whether their owners might like to be reminded to lock the door or turn off a device. Some people love the idea. Others don’t.
Internet-enabled appliances weren’t the only show in town last week. The strong performance of the U.S. economy earned a standing ovation from investors who pushed the Dow Jones Industrial Index and the Standard & Poor’s 500 Index to new highs. Many global stock markets moved higher, too. Ben Levisohn of Barron’s reported: “One need only look overseas for a sign that investors are feeling better about the state of the world – or at least better enough to do some bargain-hunting. China’s Shanghai Composite rose 4.3 percent this past week, though it is still down 21 percent from its January high…”
The news in a FactSet Insight written by John Butters may dampen some investors’ enthusiasm.
With the third quarter earnings season ahead, Butters reported 98 of the companies in the Standard & Poor’s 500 Index have issued guidance. The majority (76 percent) issued negative guidance, meaning they anticipate earnings will be lower than analysts’ mean earnings per share estimates. It’s important to remember that, historically, the U.S. economy has moved in cycles. We may be in the latter stages of this expansion. The next stage is contraction and no one can predict exactly when it may occur.
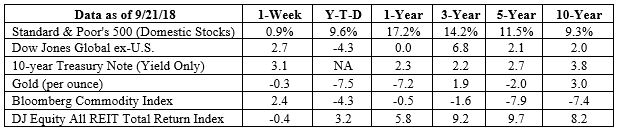
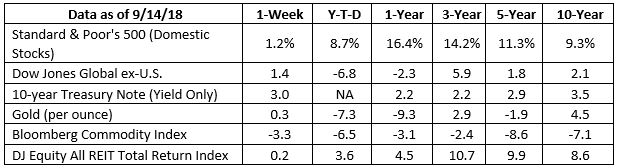
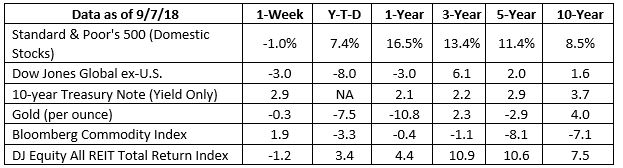
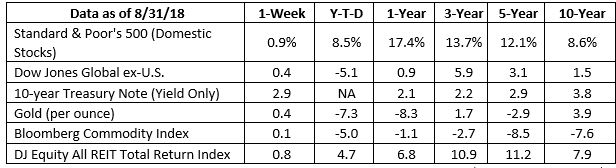
S&P 500, Dow Jones Global ex-US, Gold, Bloomberg Commodity Index returns exclude reinvested dividends (gold does not pay a dividend) and the three-, five-, and 10-year returns are annualized; the DJ Equity All REIT Total Return Index does include reinvested dividends and the three-, five-, and 10-year returns are annualized; and the 10-year Treasury Note is simply the yield at the close of the day on each of the historical time periods.
Sources: Yahoo! Finance, Barron’s, djindexes.com, London Bullion Market Association.
Past performance is no guarantee of future results. Indices are unmanaged and cannot be invested into directly. N/A means not applicable.
Millennials don’t exist! Gen Xers and the Silent Generation get a lot less press than Millennials, but all three generations have one thing in common. According to comedian Adam Conover, “Generations in general don’t exist. They’re not real things that exist in nature. We made them up…Here’s what really exists: People who are alive at the same time.” He may have a point.
The only generation that has been recognized officially by the U.S. government is the Baby Boom generation. At least, that’s what a U.S. Census Bureau spokesperson told Philip Bump of The Atlantic. The Baby Boom generation was recognized because its members were part of a demographic event. Encyclopedia Britannica explained the baby boom as: “…the U.S. increase in the birth rate between 1946 and 1964; also, the generation born in the U.S. during that period. The hardships and uncertainties of the Great Depression and World War II led many unmarried couples to delay marriage and many married couples to delay having children. The war’s end, followed by a sustained period of economic prosperity (the 1950s and early 1960s), was accompanied by a surge in population. The sheer size of the baby-boom generation (some 75 million) magnified its impact on society…”
So, where did other generations originate?
Sarah Laskow of The Atlantic reported, until the 19th century, generations were thought of as biological relationships within families. For example, grandparents would be one generation, their children the next, and their grandchildren the next, and so on.
The idea of societal generations – people who live at the same time and experience the same things – came from European intellectuals in the 1800s and early 1900s who advised, “people do not react to their particular historical conundrums as a monolithic group.”
Every person is unique and individual.
Weekly Focus – Think About It
“The power of youth is the common wealth for the entire world. The faces of young people are the faces of our past, our present, and our future. No segment in the society can match with the power, idealism, enthusiasm, and courage of the young people.”
–Kailash Satyarthi, Nobel Prize winner and activist
Best regards,
John F. Reutemann, Jr., CLU, CFP®
P.S. Please feel free to forward this commentary to family, friends, or colleagues. If you would like us to add them to the list, please reply to this email with their email address and we will ask for their permission to be added.
Investment advice offered through Research Financial Strategies, a registered investment advisor.
* This newsletter and commentary expressed should not be construed as investment advice.
* Government bonds and Treasury Bills are guaranteed by the U.S. government as to the timely payment of principal and interest and, if held to maturity, offer a fixed rate of return and fixed principal value. However, the value of fund shares is not guaranteed and will fluctuate.
* Corporate bonds are considered higher risk than government bonds but normally offer a higher yield and are subject to market, interest rate and credit risk as well as additional risks based on the quality of issuer coupon rate, price, yield, maturity, and redemption features.
* The Standard & Poor’s 500 (S&P 500) is an unmanaged group of securities considered to be representative of the stock market in general. You cannot invest directly in this index.
* All indexes referenced are unmanaged. Unmanaged index returns do not reflect fees, expenses, or sales charges. Index performance is not indicative of the performance of any investment.
* The Dow Jones Global ex-U.S. Index covers approximately 95% of the market capitalization of the 45 developed and emerging countries included in the Index.
* The 10-year Treasury Note represents debt owed by the United States Treasury to the public. Since the U.S. Government is seen as a risk-free borrower, investors use the 10-year Treasury Note as a benchmark for the long-term bond market.
* Gold represents the afternoon gold price as reported by the London Bullion Market Association. The gold price is set twice daily by the London Gold Fixing Company at 10:30 and 15:00 and is expressed in U.S. dollars per fine troy ounce.
* The Bloomberg Commodity Index is designed to be a highly liquid and diversified benchmark for the commodity futures market. The Index is composed of futures contracts on 19 physical commodities and was launched on July 14, 1998.
* The DJ Equity All REIT Total Return Index measures the total return performance of the equity subcategory of the Real Estate Investment Trust (REIT) industry as calculated by Dow Jones.
* International investing involves special risks such as currency fluctuation and political instability and may not be suitable for all investors.
* Yahoo! Finance is the source for any reference to the performance of an index between two specific periods.
* Opinions expressed are subject to change without notice and are not intended as investment advice or to predict future performance.
* Economic forecasts set forth may not develop as predicted and there can be no guarantee that strategies promoted will be successful.
* Past performance does not guarantee future results. Investing involves risk, including loss of principal.
* You cannot invest directly in an index.
* Stock investing involves risk including loss of principal.
* Consult your financial professional before making any investment decision.
* To unsubscribe from the Weekly Market Commentary please reply to this e-mail with “Unsubscribe” in the subject.
Sources:
https://www.vox.com/the-goods/2018/9/21/17886682/amazon-new-smart-home-microwave-speakers-internet-of-things
https://www.barrons.com/articles/dow-hits-record-amid-global-stock-rally-1537577592
https://www.barrons.com/articles/the-dow-hits-a-record-high-as-tech-sits-it-out-1537580378
https://insight.factset.com/highest-percentage-of-negative-eps-preannouncements-for-sp-500-since-q1-2016
https://www.youtube.com/watch?v=-HFwok9SlQQ (4:28 minute-mark)
https://www.theatlantic.com/national/archive/2014/03/here-is-when-each-generation-begins-and-ends-according-to-facts/359589/
https://www.britannica.com/science/baby-boom
https://www.theatlantic.com/technology/archive/2014/09/the-generation-of-generations/379989/
https://www.brainyquote.com/quotes/kailash_satyarthi_751646?src=t_youth